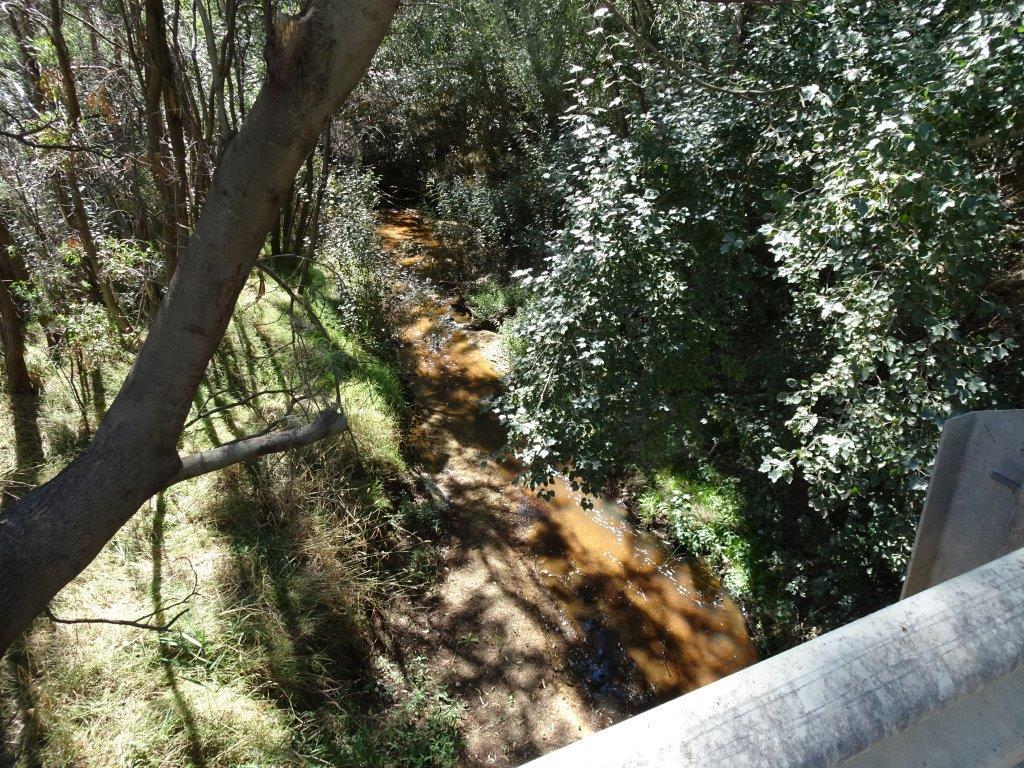
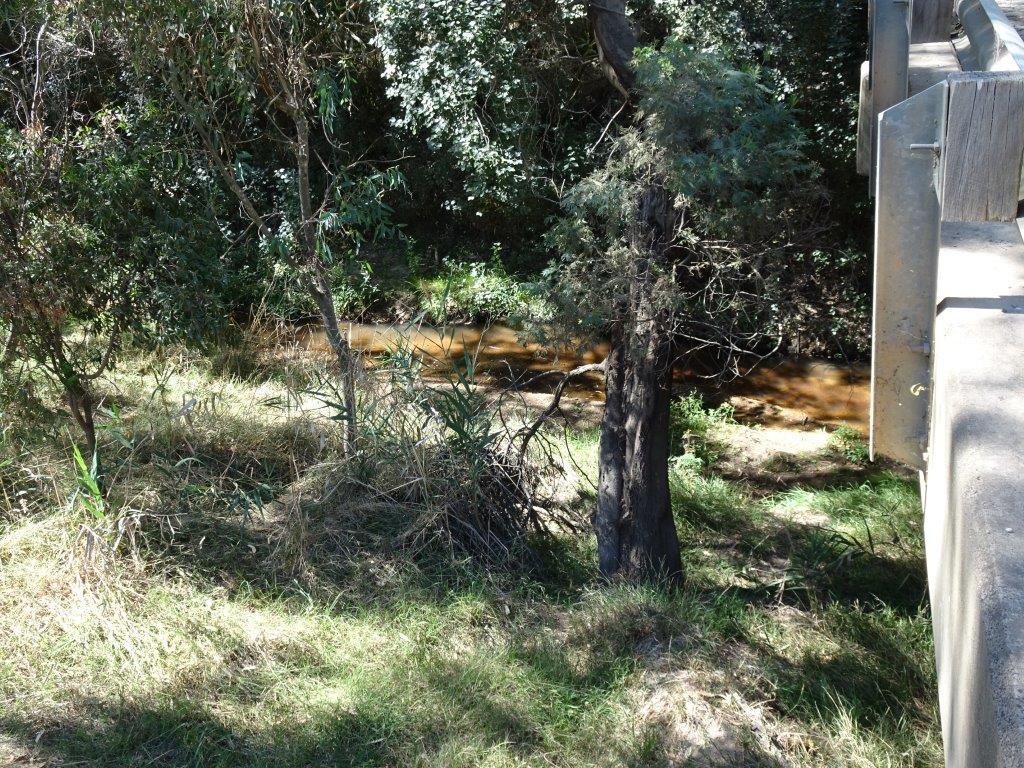
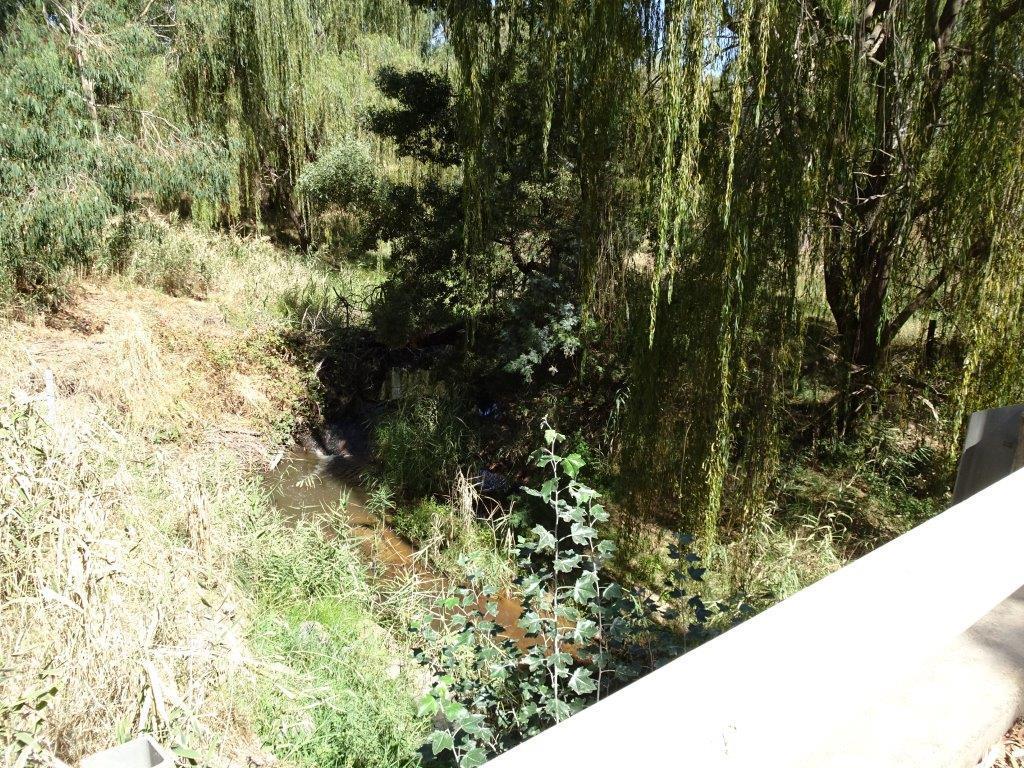
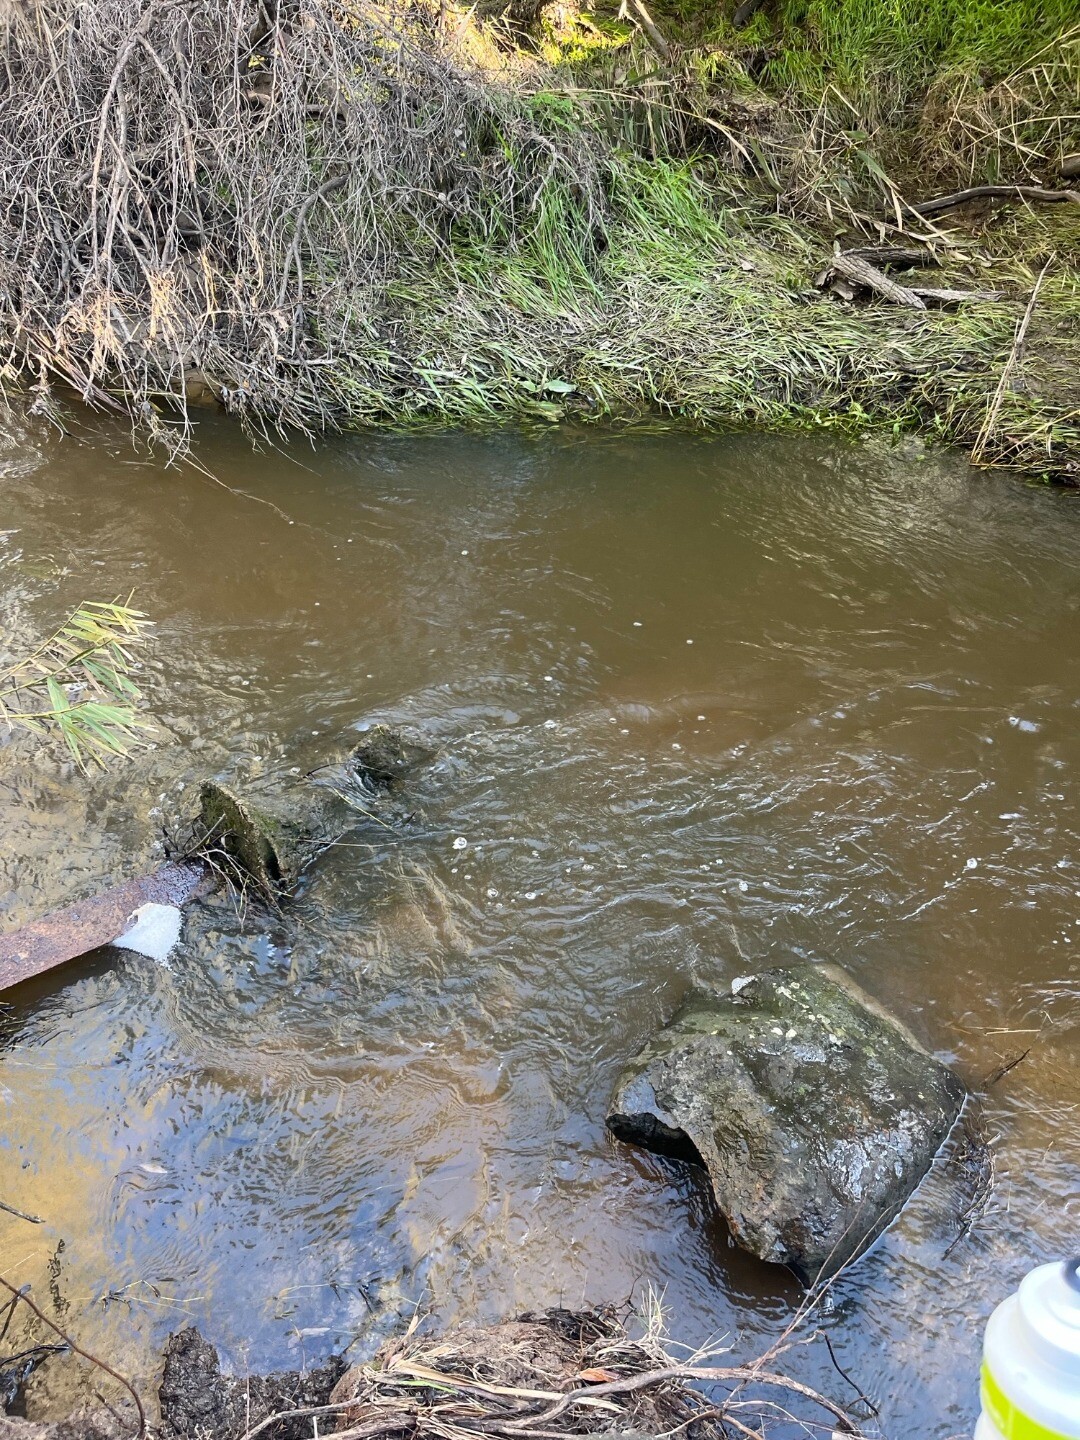
Active Reach: 5_28 Creightons Creek
| GB_Central |
| GB_Mid West |
| Bank Erosion Stability | Bank Vegetation | In Stream Cover | Riffles Pools Bends | Verge Vegetation | |
|---|---|---|---|---|---|
| July 2026 | Excellent | Excellent | Excellent | Excellent | Excellent |
| June 2026 | Excellent | Excellent | Excellent | Excellent | Excellent |
| May 2026 | Excellent | Excellent | Excellent | Excellent | Excellent |
| April 2026 | Excellent | Excellent | Excellent | Excellent | Excellent |
| March 2026 | Excellent | Excellent | Excellent | Excellent | Excellent |
| February 2026 | Good | Good | Good | Good | Good |
| January 2026 | Excellent | Good | Poor | Poor | Fair |
| creek has stopped flowing | |||||
| December 2025 | Excellent | Excellent | Excellent | Excellent | Excellent |
| November 2025 | Excellent | Excellent | Excellent | Excellent | Excellent |
| October 2025 | Excellent | Excellent | Excellent | Excellent | Excellent |
| September 2025 | Excellent | Excellent | Excellent | Excellent | Excellent |
| August 2025 | Excellent | Excellent | Good | Good | Good |
| June 2025 | Good | Good | Good | Good | Good |
| May 2025 | Good | Good | Good | Good | Good |
| April 2025 | Good | Good | Good | Good | Fair |
| February 2025 | Excellent | Good | Fair | Poor | Fair |
| January 2025 | Good | Good | Good | Good | Good |
| December 2024 | Good | Good | Good | Good | Good |
| November 2024 | Excellent | Excellent | Excellent | Excellent | Excellent |
| October 2024 | Excellent | Excellent | Excellent | Excellent | Good |
| September 2024 | Excellent | Excellent | Good | Good | Excellent |
| August 2024 | Excellent | Excellent | Good | Good | Good |
| May 2024 | Good | Good | Good | Good | Good |
| April 2024 | Good | Good | Good | Good | Good |
| March 2024 | Excellent | Excellent | Excellent | Excellent | Excellent |
| February 2024 | Good | Good | Good | Good | Good |
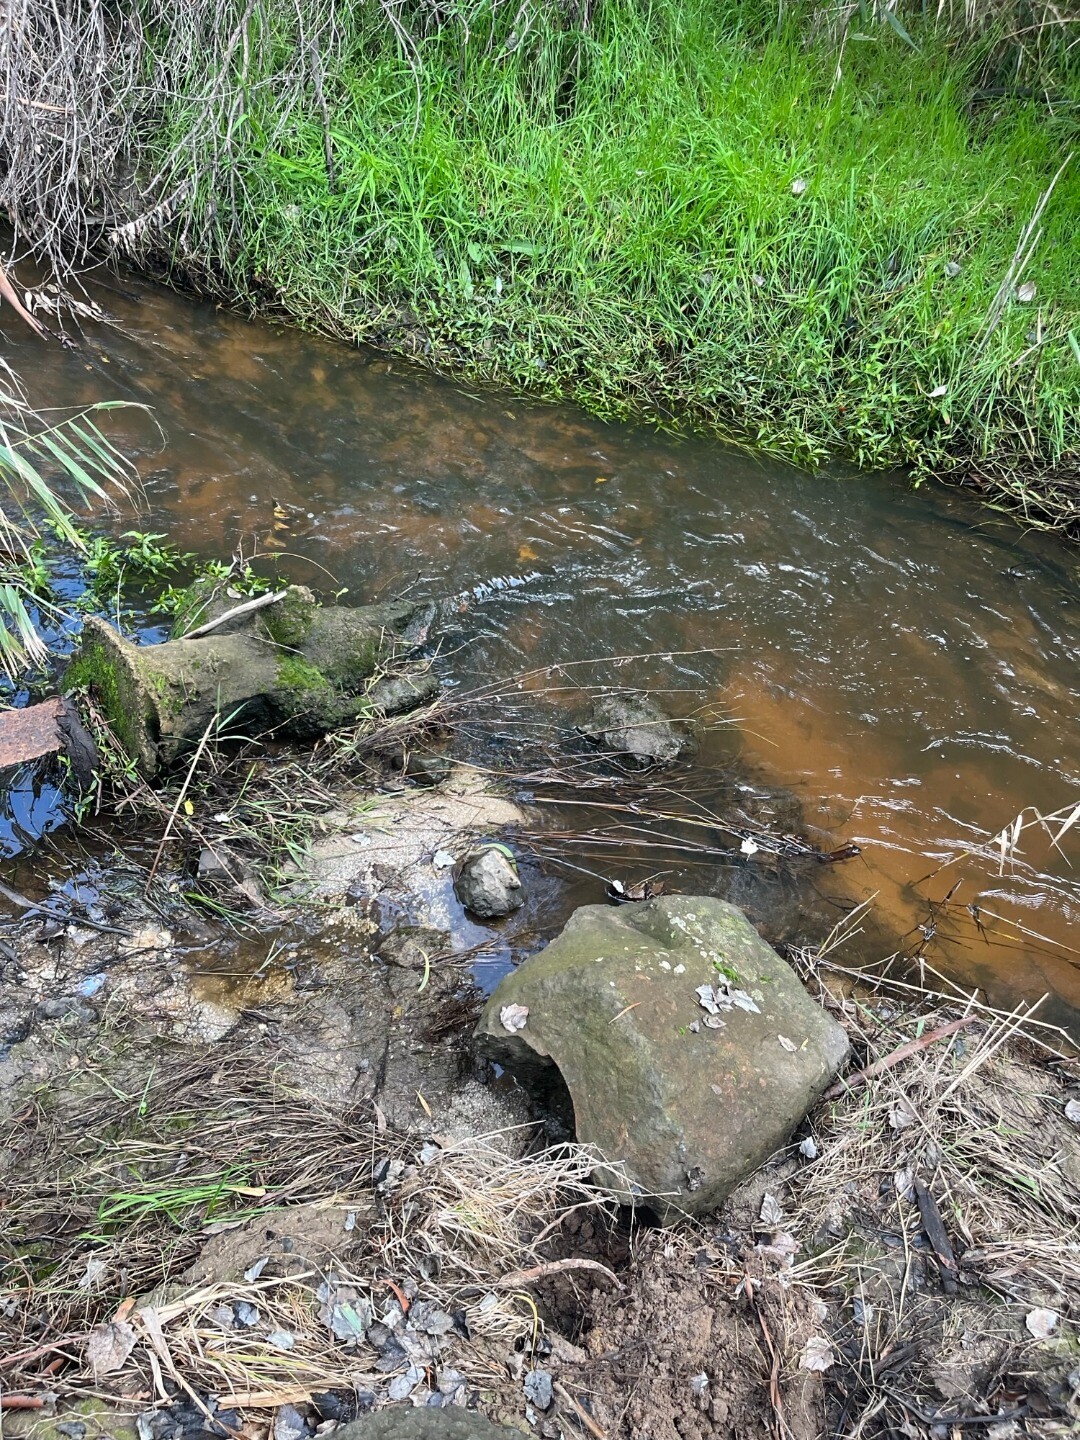
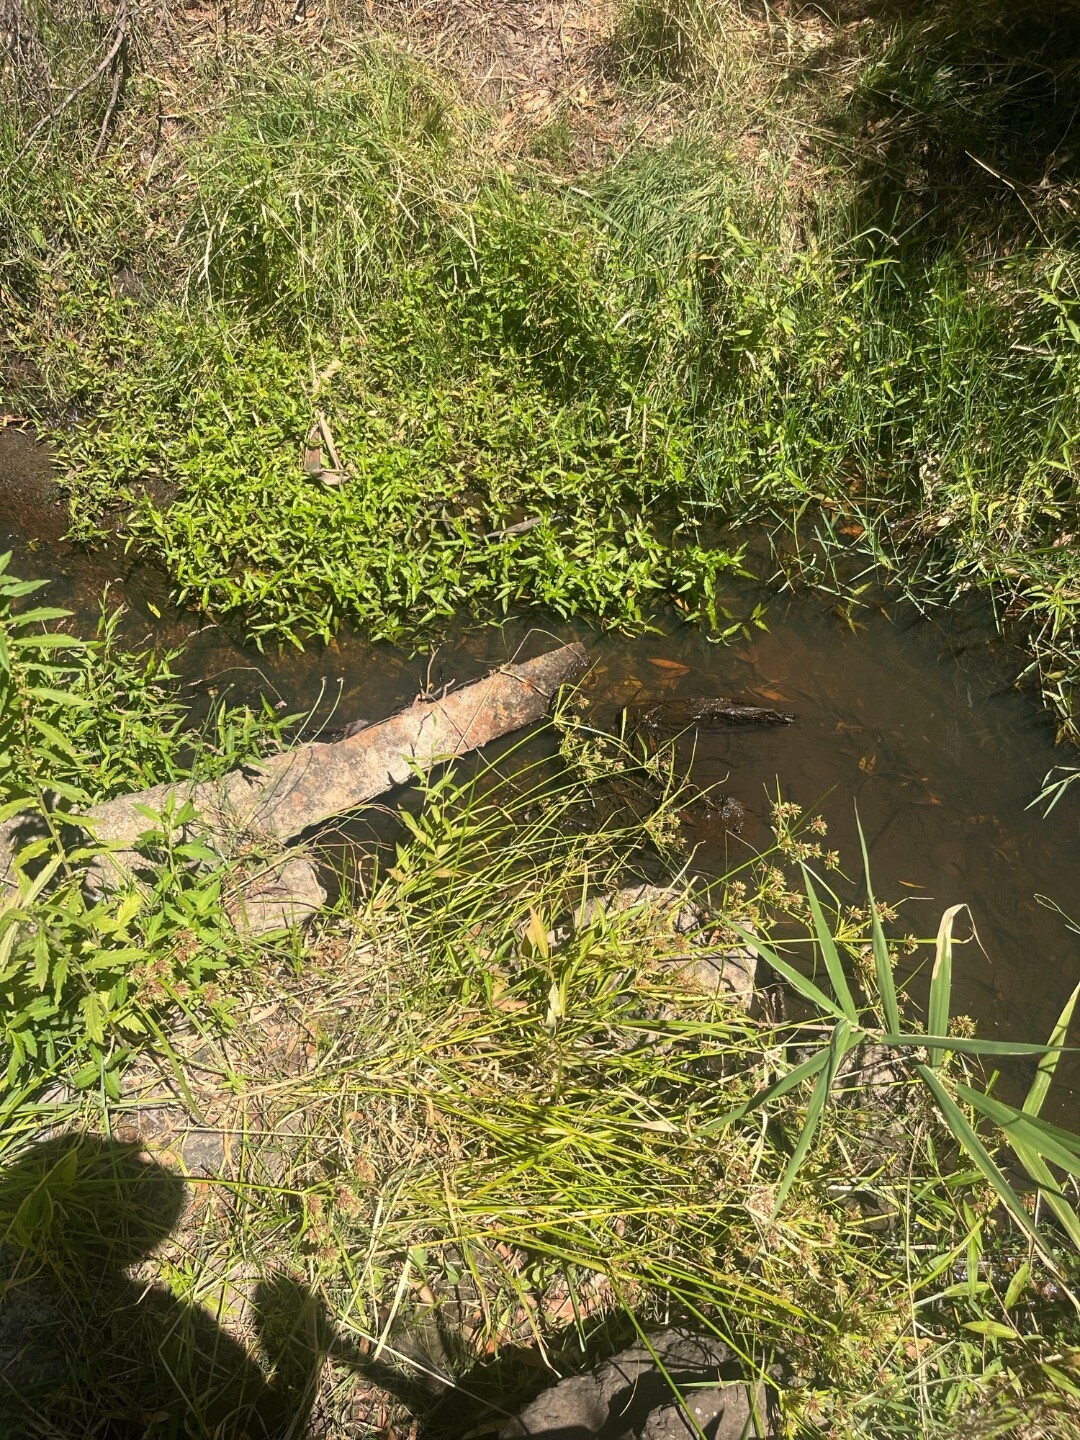
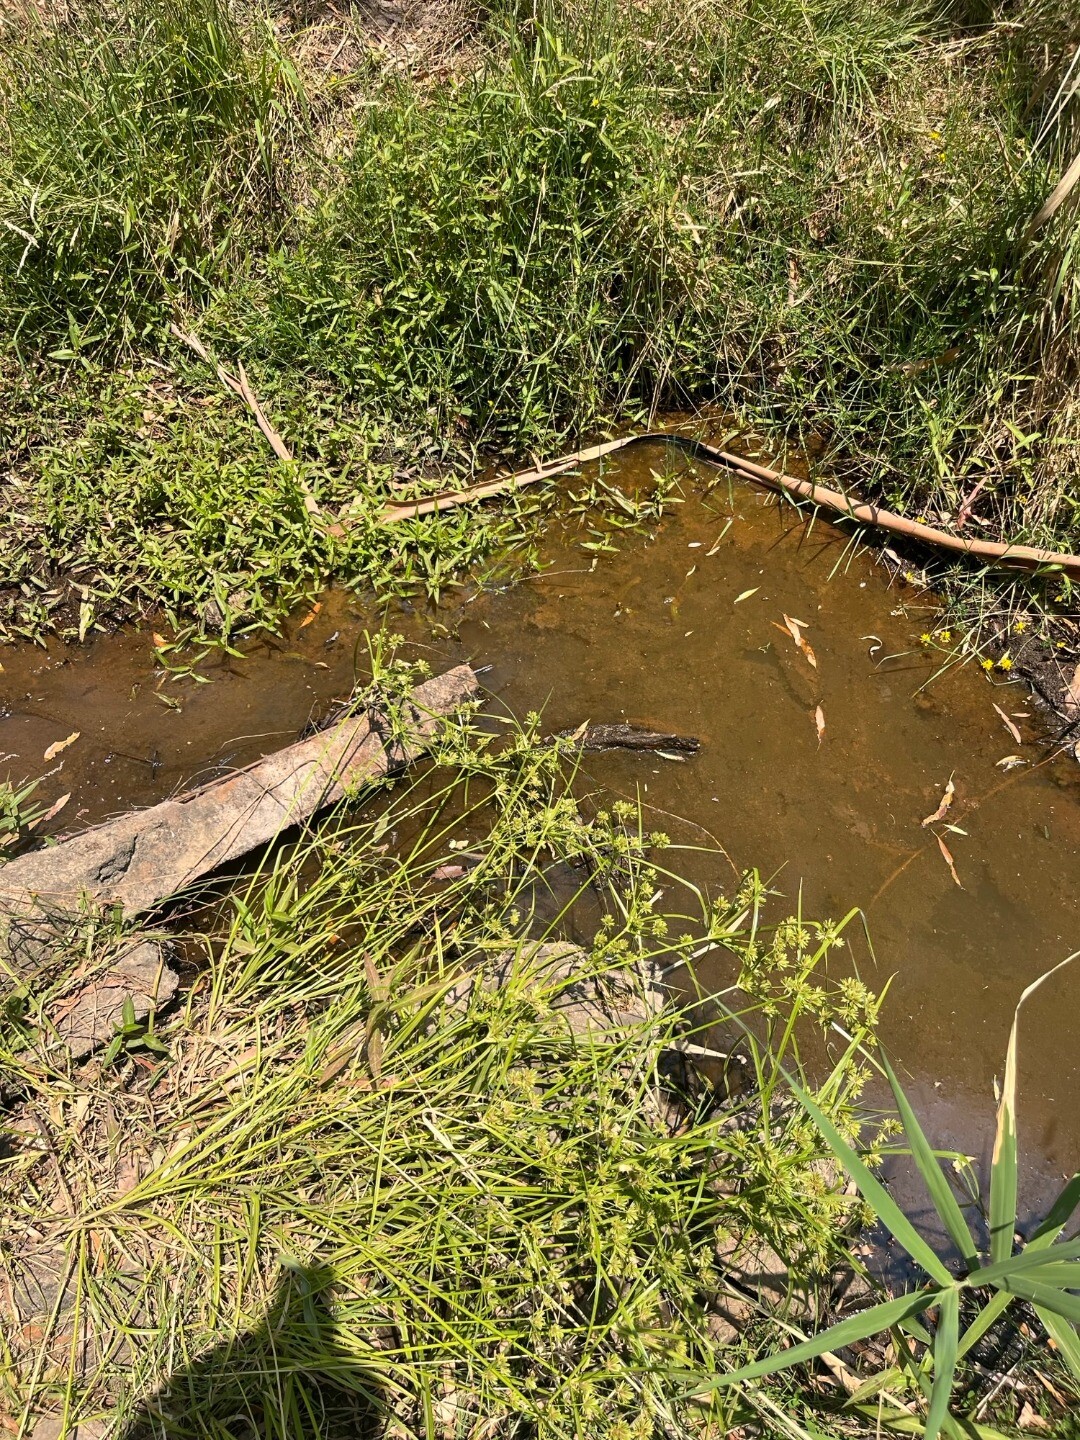
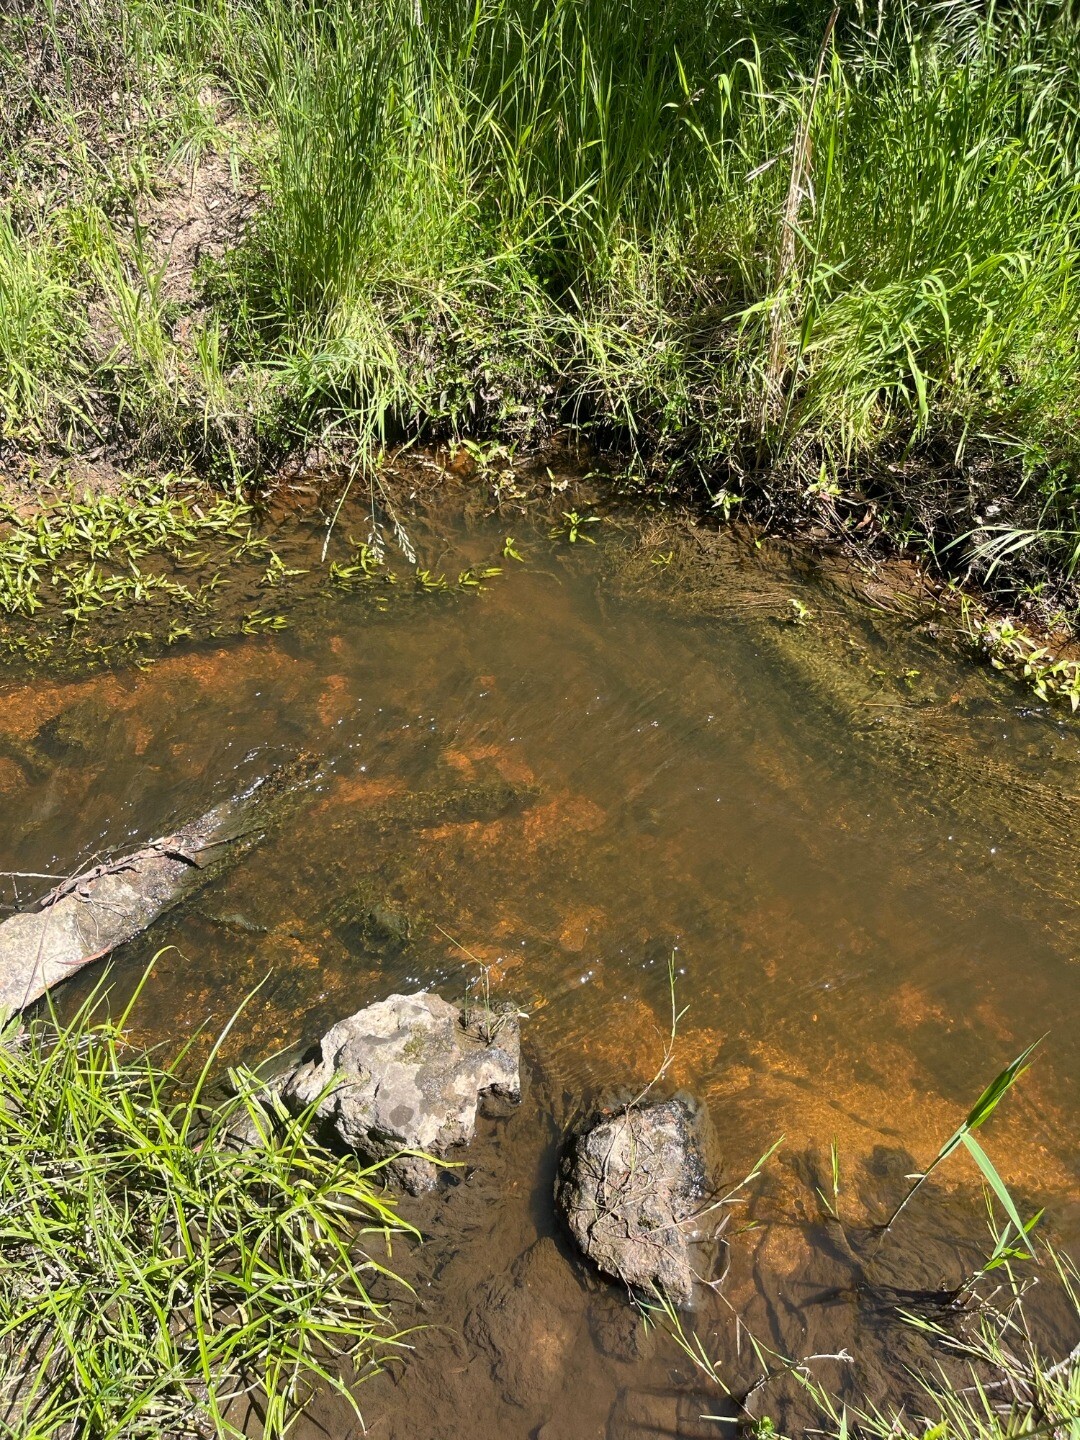
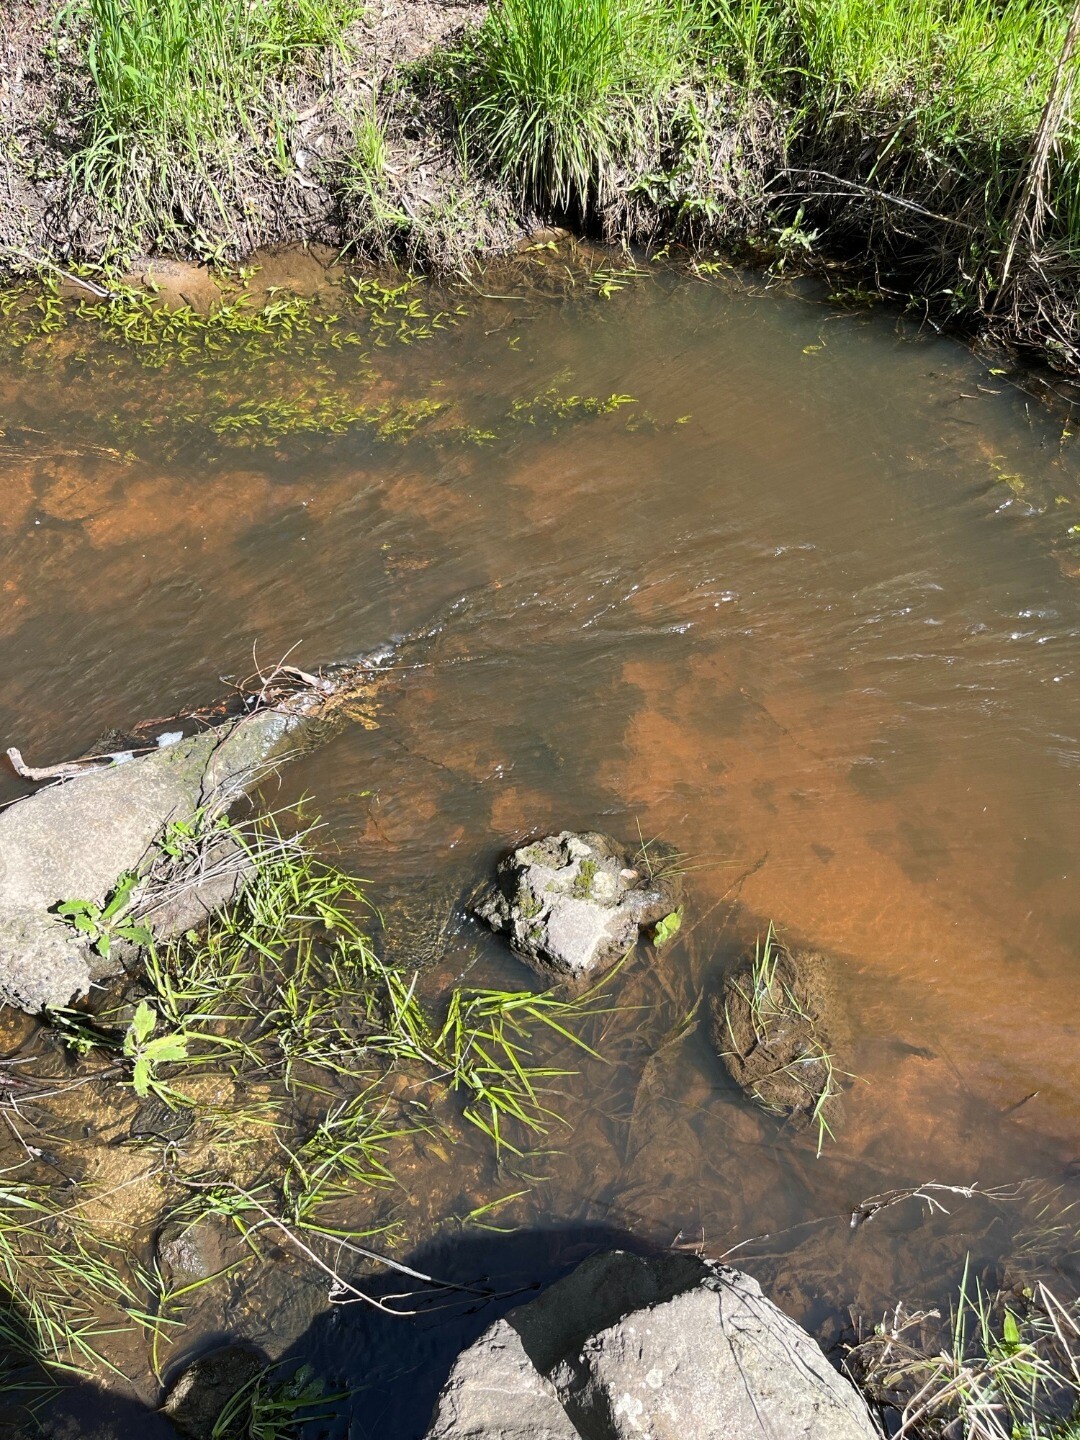
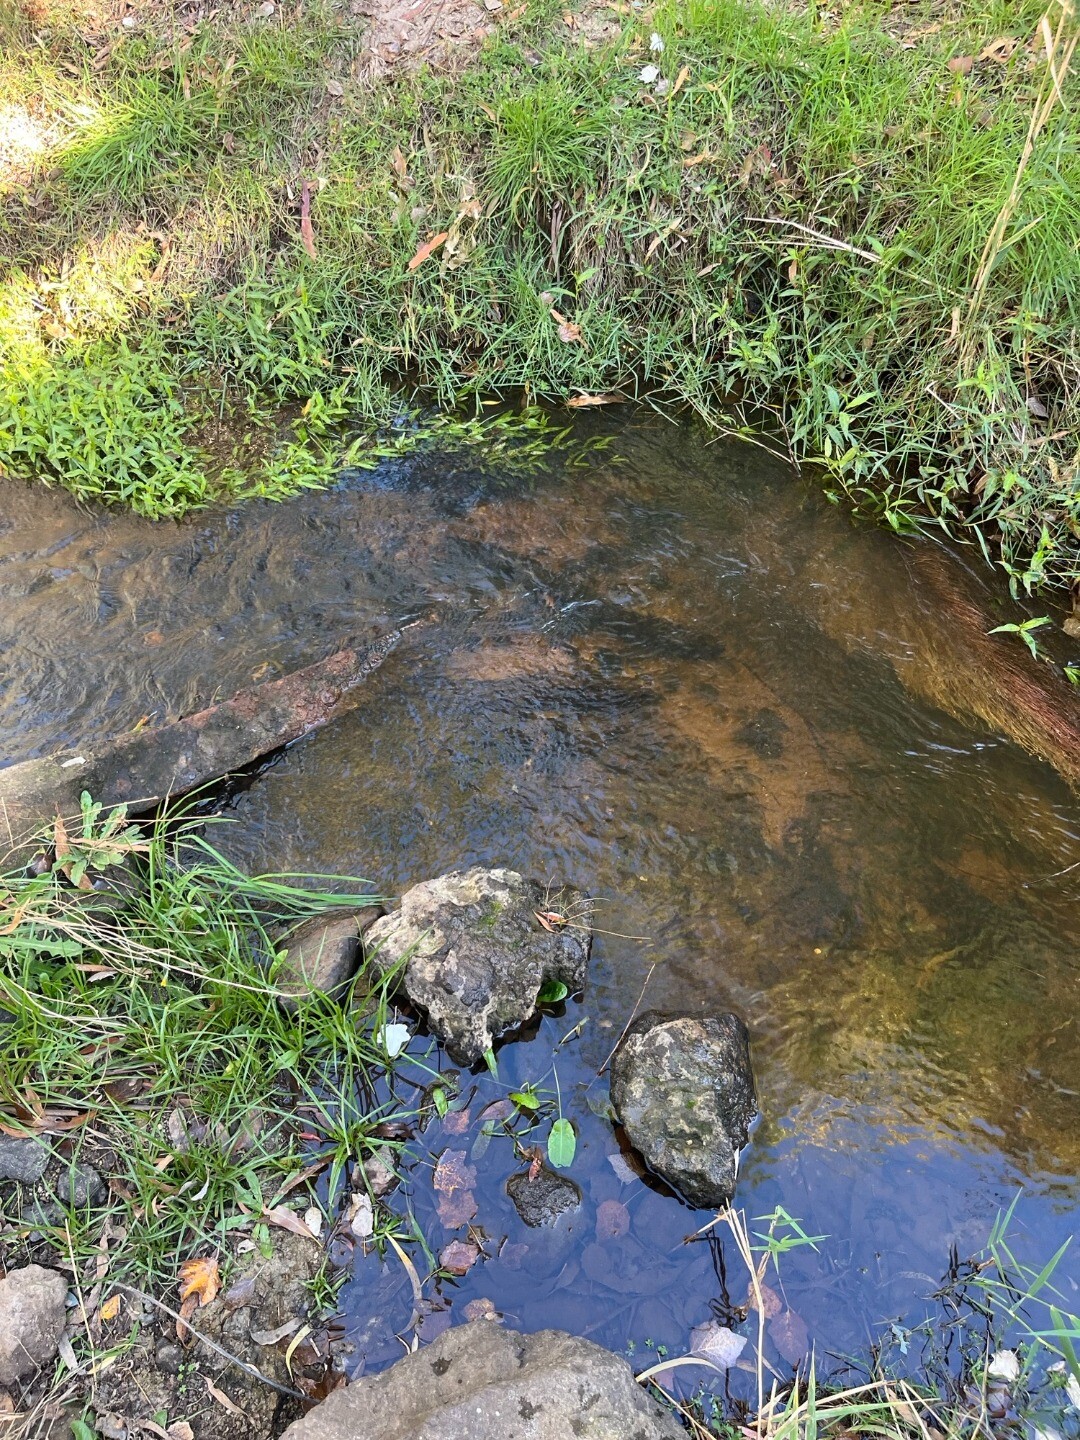
| January 2024 | Good | Good | Good | Good | Good |
see attached pic |
|||||
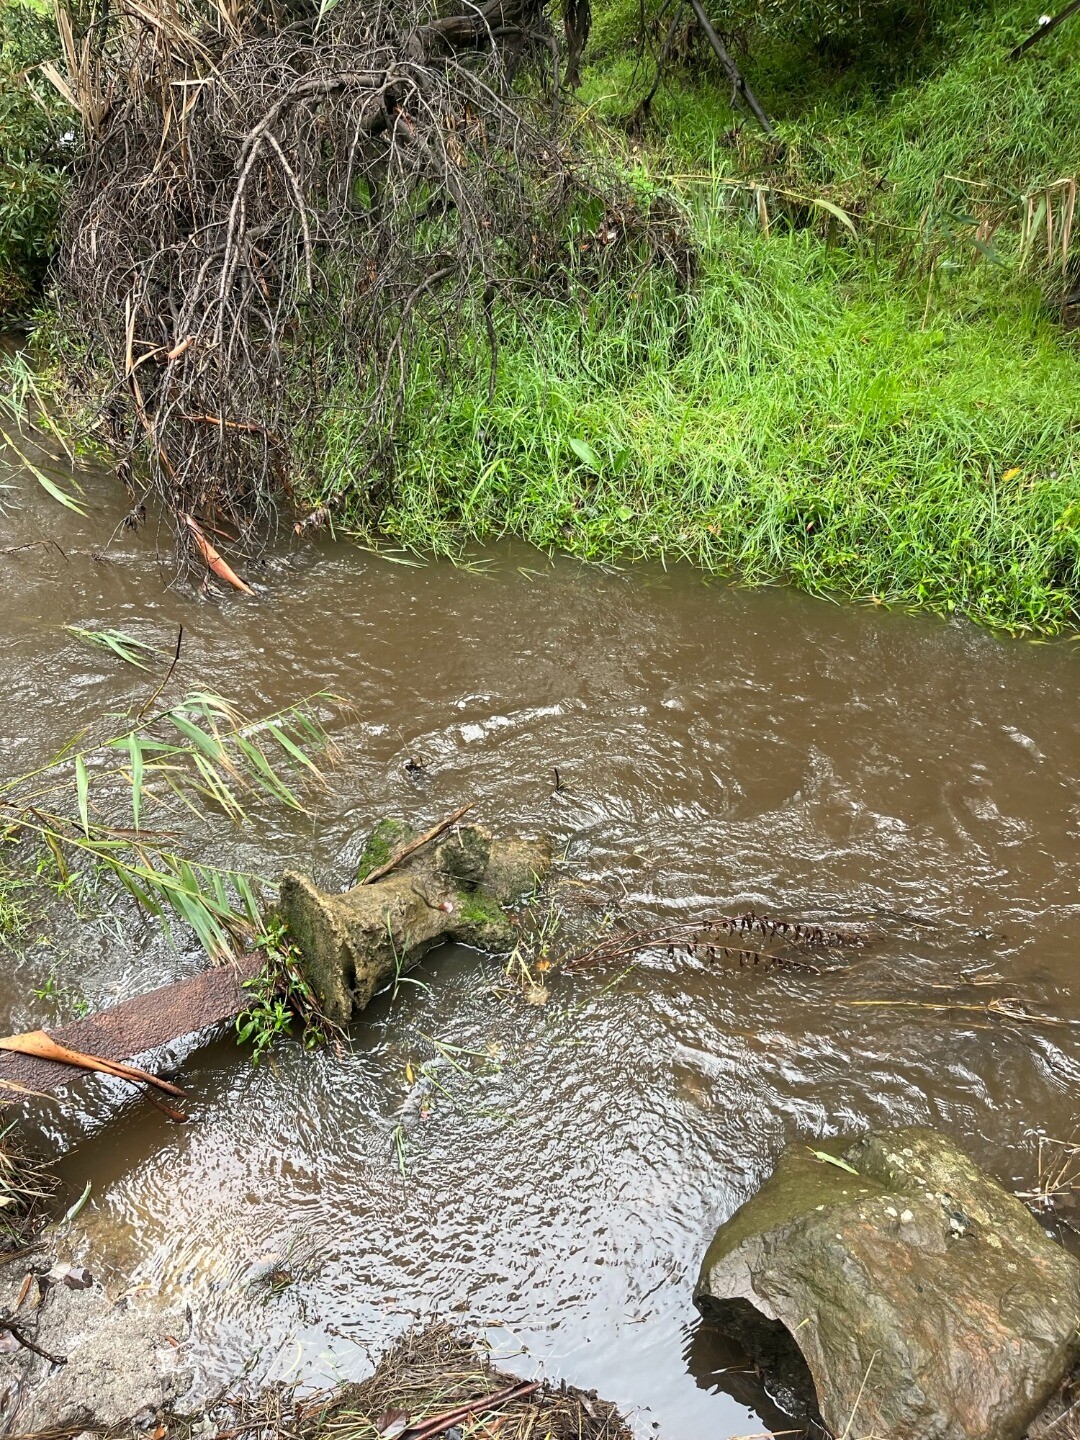
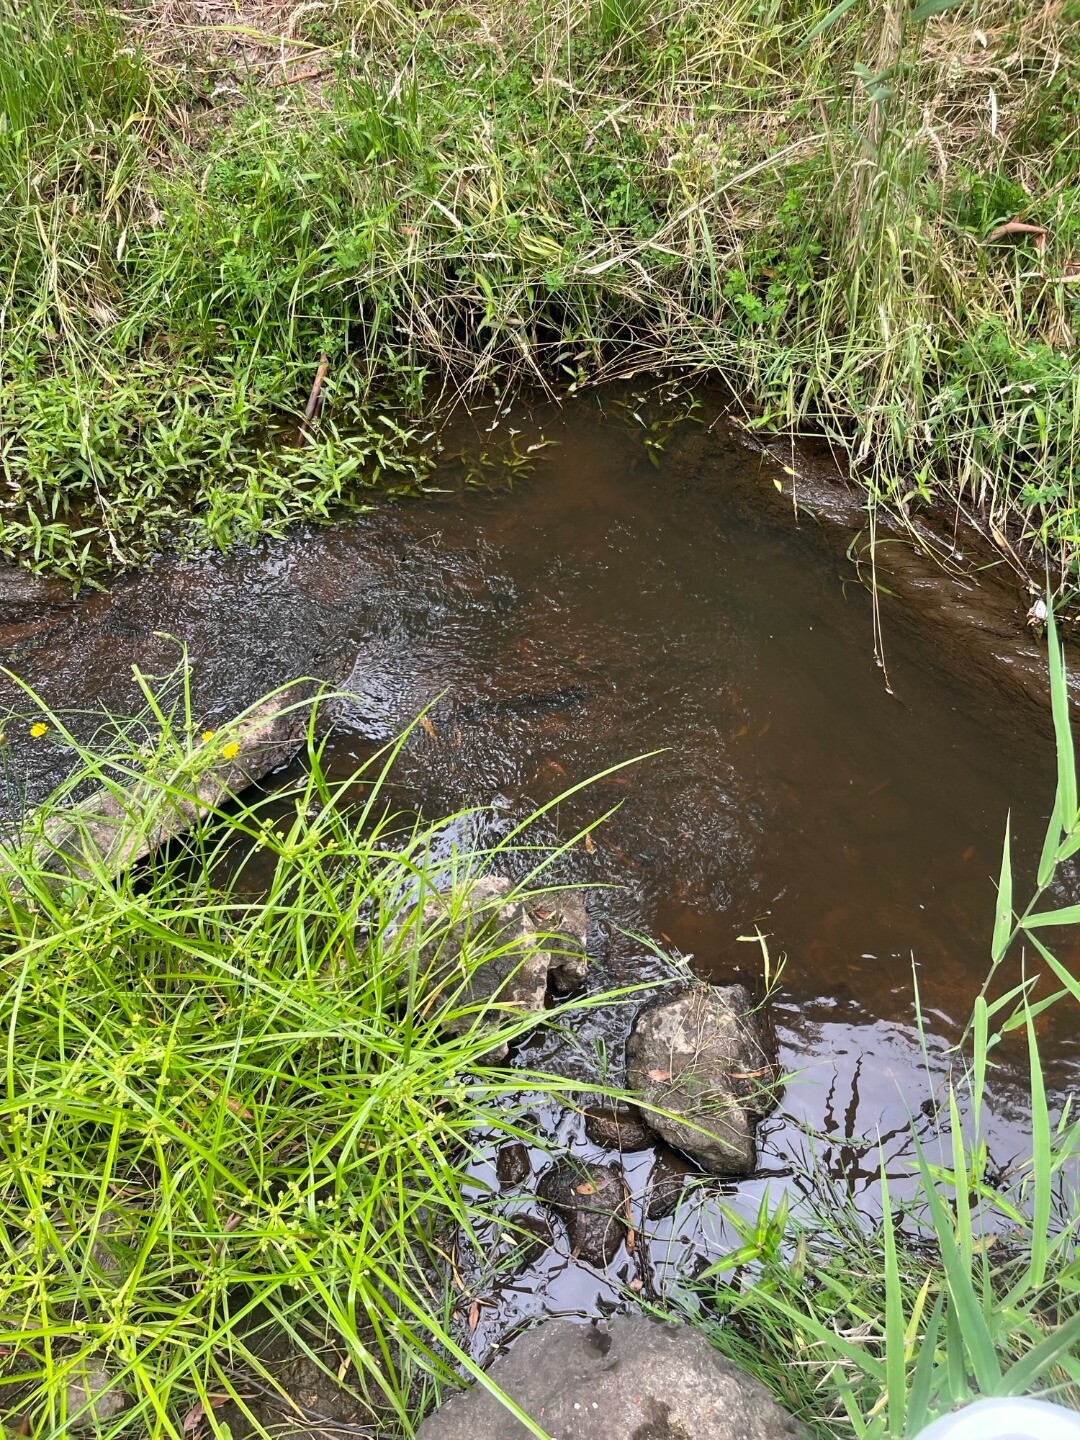
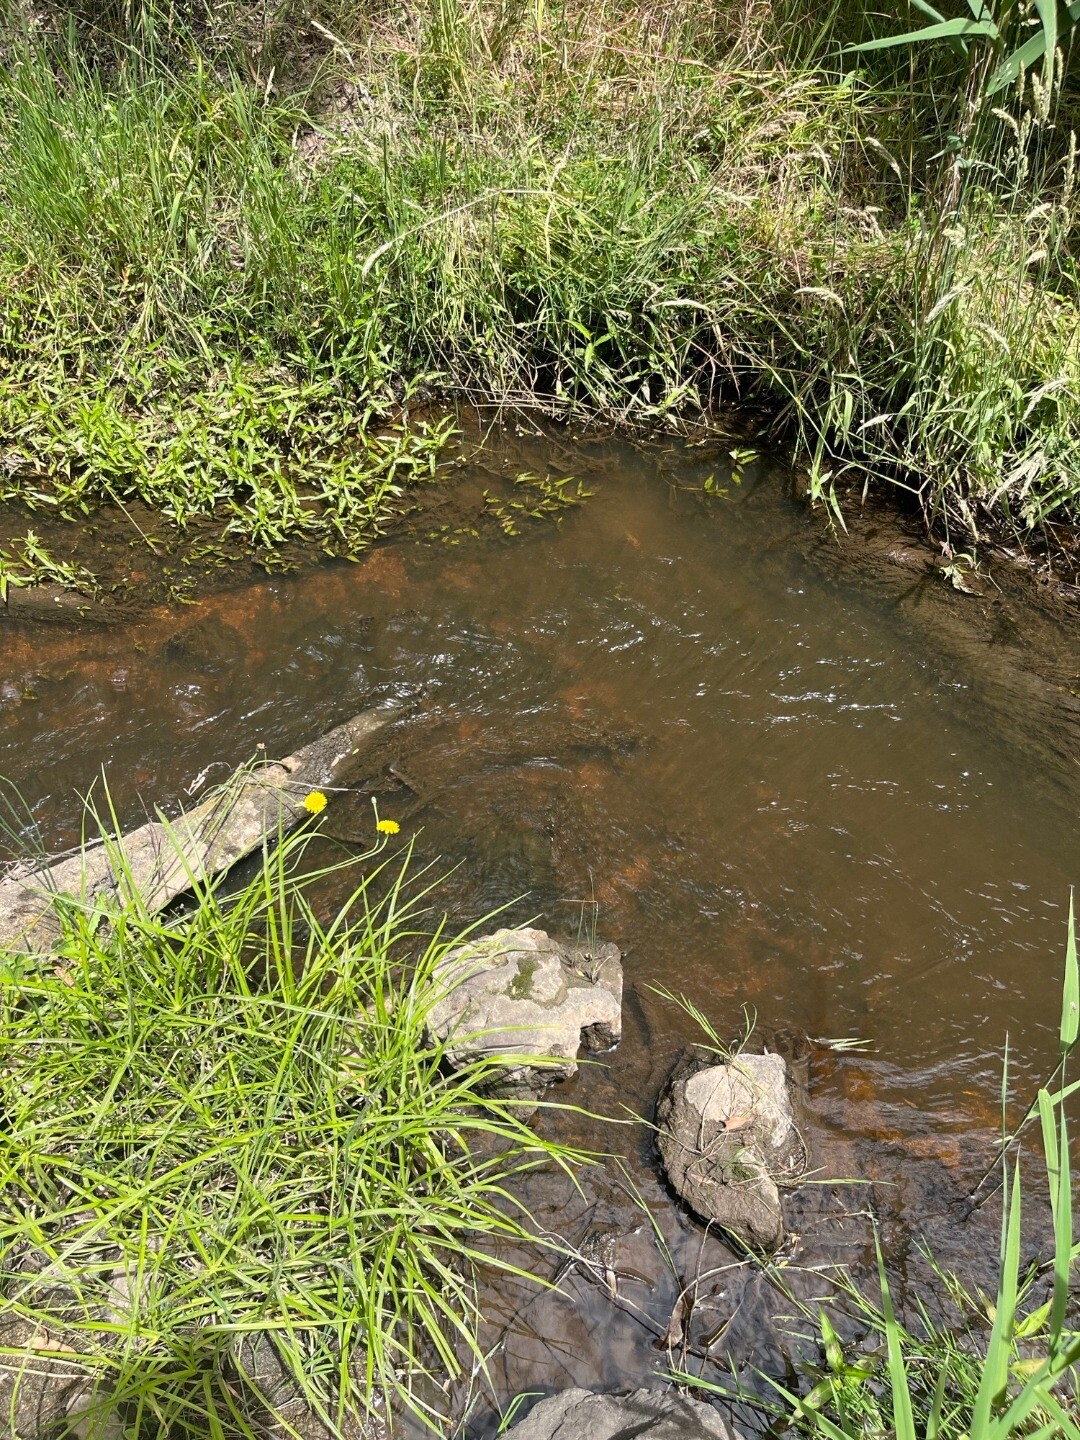
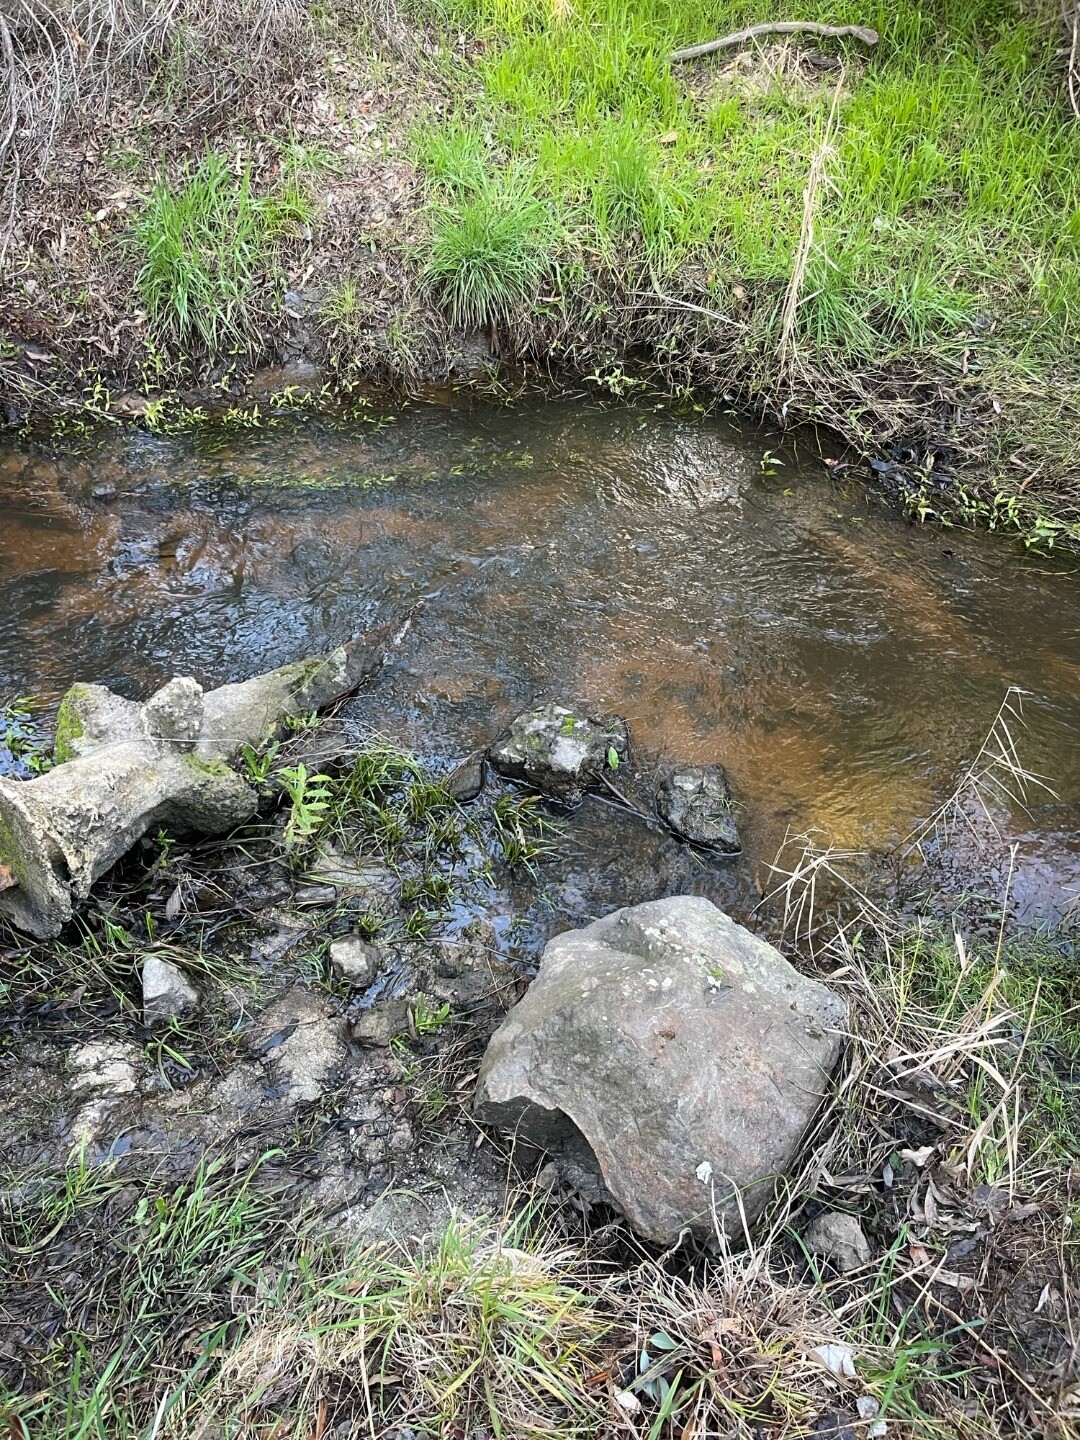
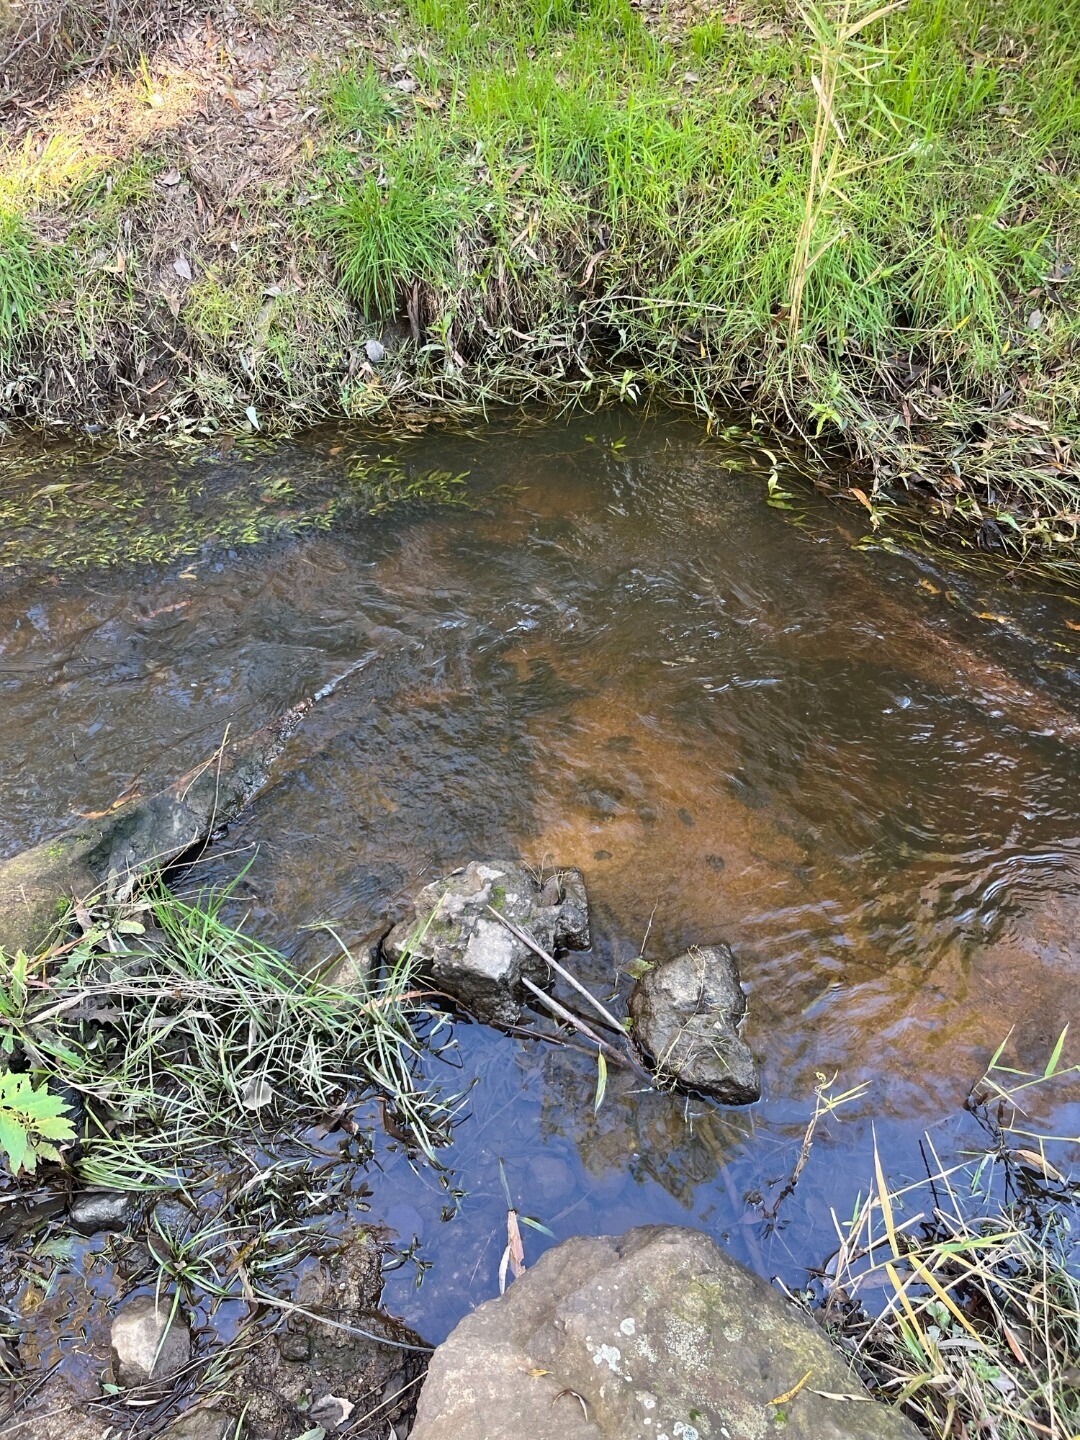
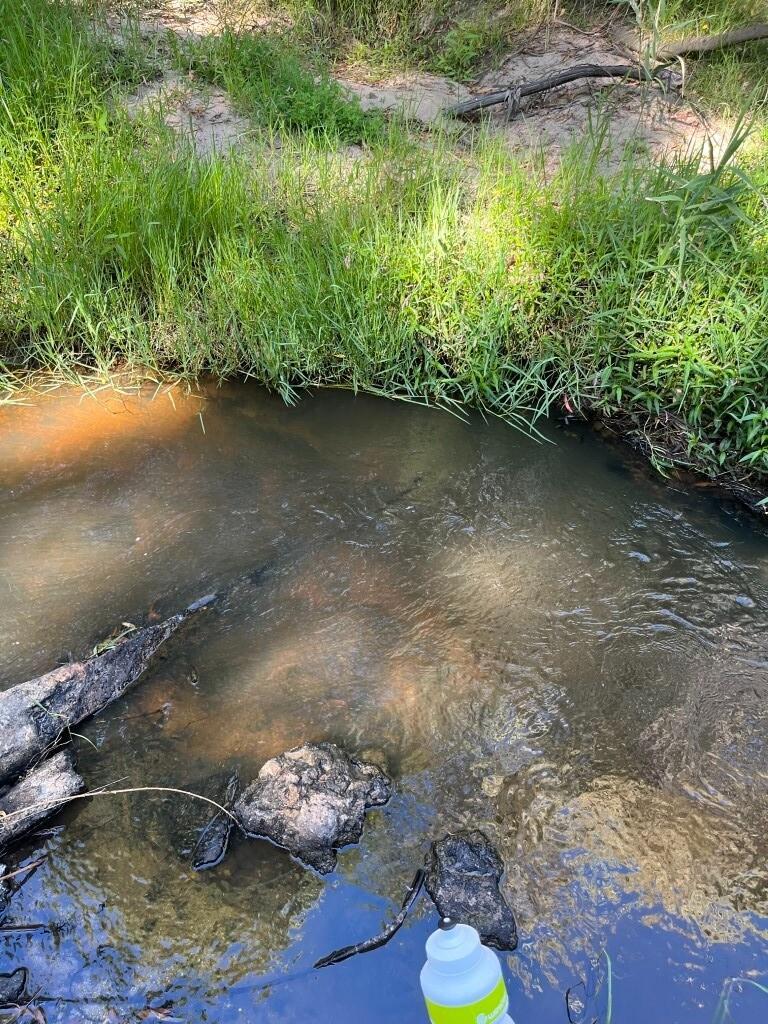
| December 2023 | Good | Excellent | Good | Good | Good |
see attached pic |
|||||
| November 2023 | Good | Excellent | Good | Good | Good |
| October 2023 | Good | Good | Good | Good | Good |
| September 2023 | Good | Good | Fair | Fair | Fair |
E coliExplain for me 12-06-2003
N/A orgs/100mL
Median 488.00orgs/100mL Latest |
Dissolved Oxygen mg/LExplain for me 30-07-2004
N/A mg/L
Median 9.90mg/L Latest |
Rainfall last 48 hoursExplain for me 19-02-2017 to 07-07-2026
0.00 mm
Median 0.00mm Latest |
Total ColiformsExplain for me 12-06-2003
N/A orgs/100mL
Median 1203.00orgs/100mL Latest |
Temperature - WATERExplain for me 30-07-2004 to 07-07-2026
18.1 ° C
Median 10.1° C Latest |
pHExplain for me 30-07-2004 to 07-07-2026
6.90 pH Units
Median 6.50pH Units Latest |
Electrical ConductivityExplain for me 12-06-2003 to 07-07-2026
200.00 µS/cm
Median 184.00µS/cm Latest |
Reactive Phosphate (mg/L)Explain for me 20-05-2018
N/A mg/L P
Median 0.060mg/L P Latest |
Total PhosphorusExplain for me 12-06-2003 to 20-01-2019
0.07 mg/L
Median 0.14mg/L Latest |
Dissolved Oxygen % SaturationExplain for me 30-07-2004
N/A %
Median 94% Latest |
Turbidity - NTUExplain for me 12-06-2003 to 07-07-2026
15 NTU
Median 24NTU Latest |
| Dissolved Oxygen Saturation | pH Lower | pH Upper | Electrical Conductivity | Turbidity | Reactive Phosphorus | |
|---|---|---|---|---|---|---|
| % | pH Units | pH Units | µS/cm | NTU | mg/L P | |
| 25th Percentile | 25th Percentile | 75th Percentile | 75th Percentile | 75th Percentile | 75th Percentile | |
2021 to 2026 |
N/A0 visits |
N/A0 visits |
||||
2026 |
N/A0 visits |
N/A0 visits |
||||
2025 |
N/A0 visits |
N/A0 visits |
||||
2024 |
N/A0 visits |
N/A0 visits |
||||
2023 |
N/A0 visits |
N/A4 visits |
N/A4 visits |
N/A4 visits |
N/A3 visits |
N/A0 visits |
2022 |
N/A0 visits |
N/A0 visits |
N/A0 visits |
N/A0 visits |
N/A0 visits |
N/A0 visits |
2021 |
N/A0 visits |
N/A0 visits |
N/A0 visits |
N/A3 visits |
N/A3 visits |
N/A0 visits |
 All content, files, data and images provided by the WaterWatch Data Portal subject to a Creative Commons Attribution License
Data portal by CeRDI
All content, files, data and images provided by the WaterWatch Data Portal subject to a Creative Commons Attribution License
Data portal by CeRDI