Inactive Reach: 35_33 Erskine River
| Bank Erosion Stability | Bank Vegetation | In Stream Cover | Riffles Pools Bends | Verge Vegetation | |
|---|---|---|---|---|---|
| February 2010 | Fair | Fair | Good | Excellent | Good |
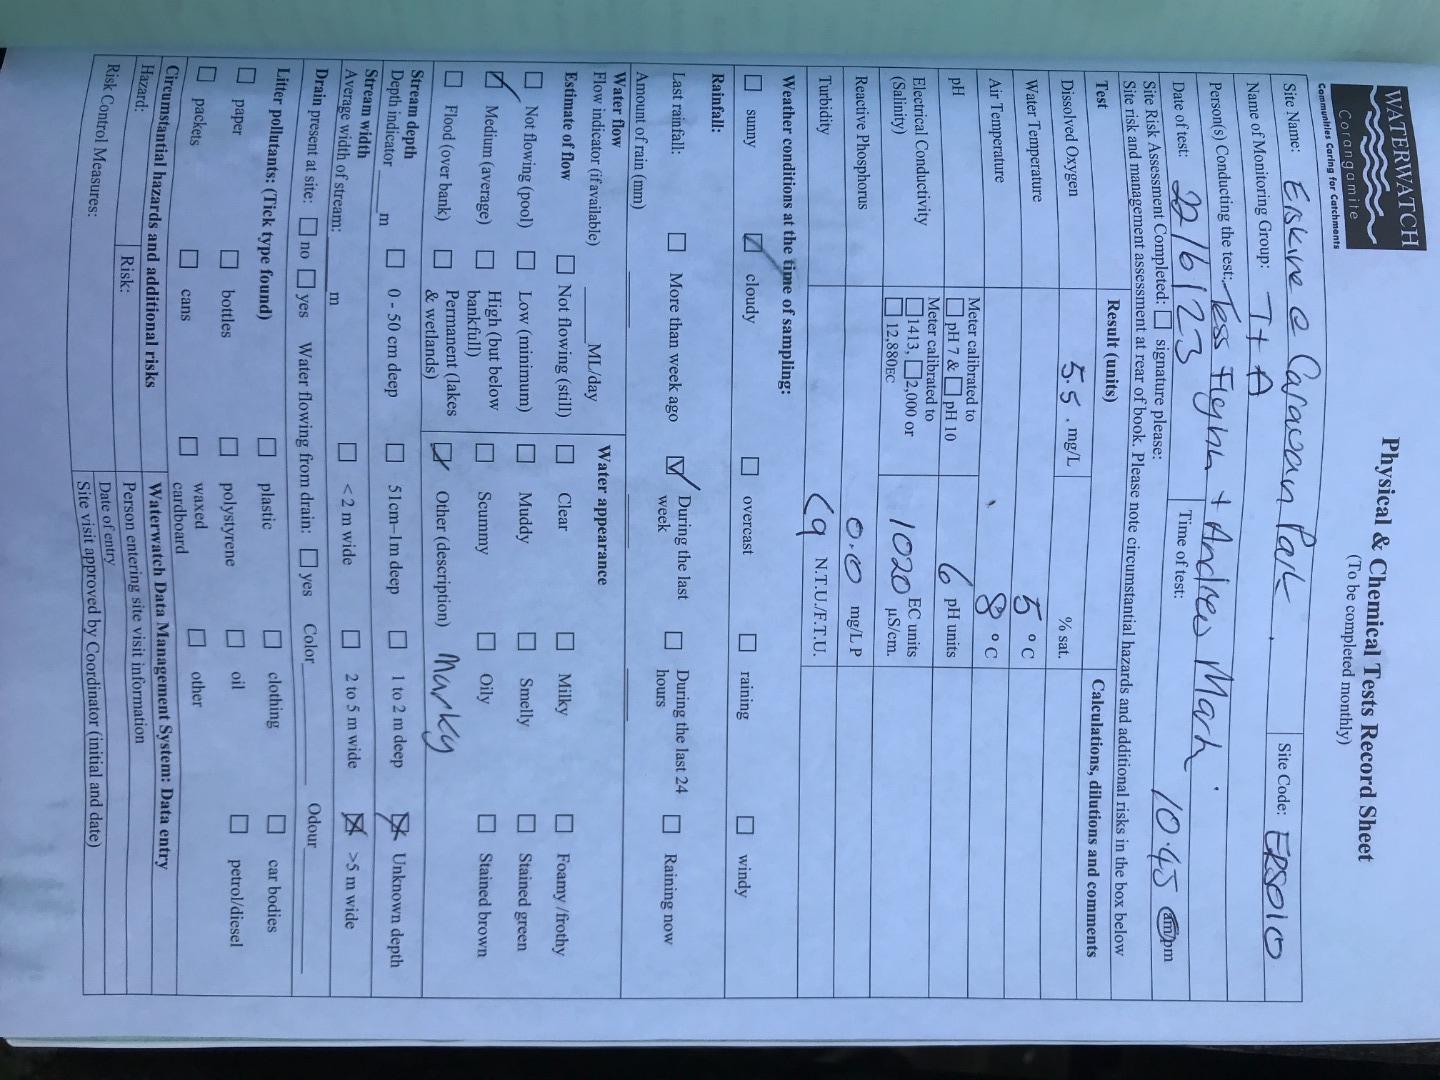
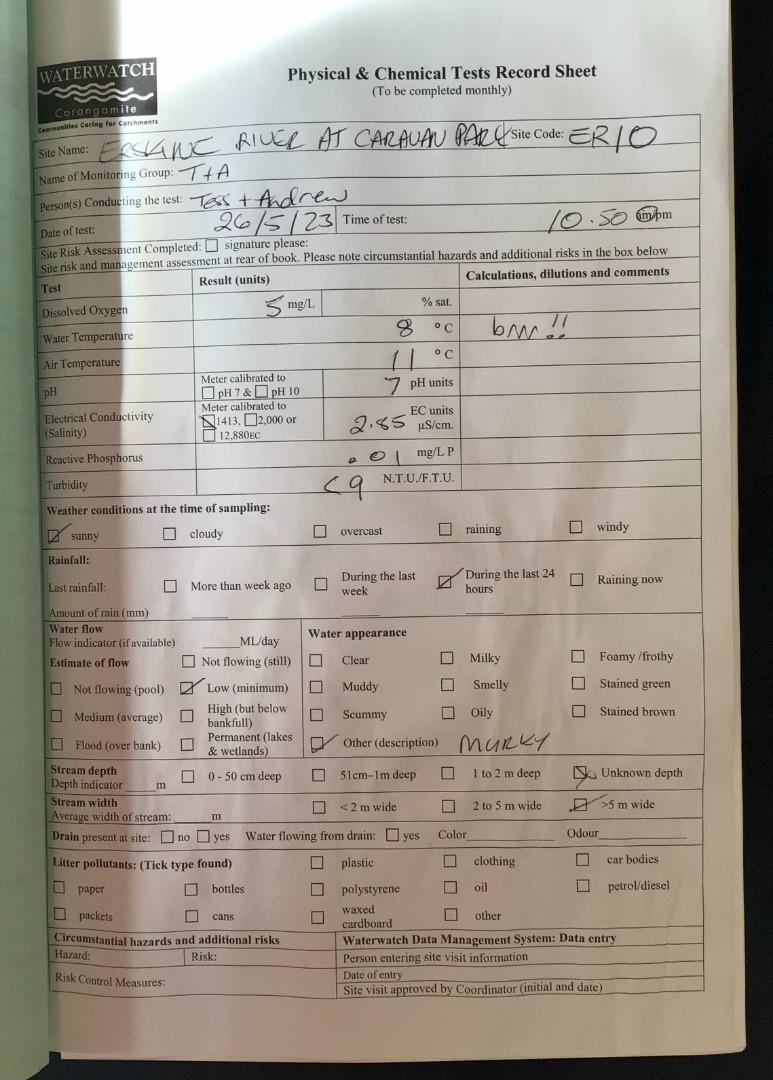
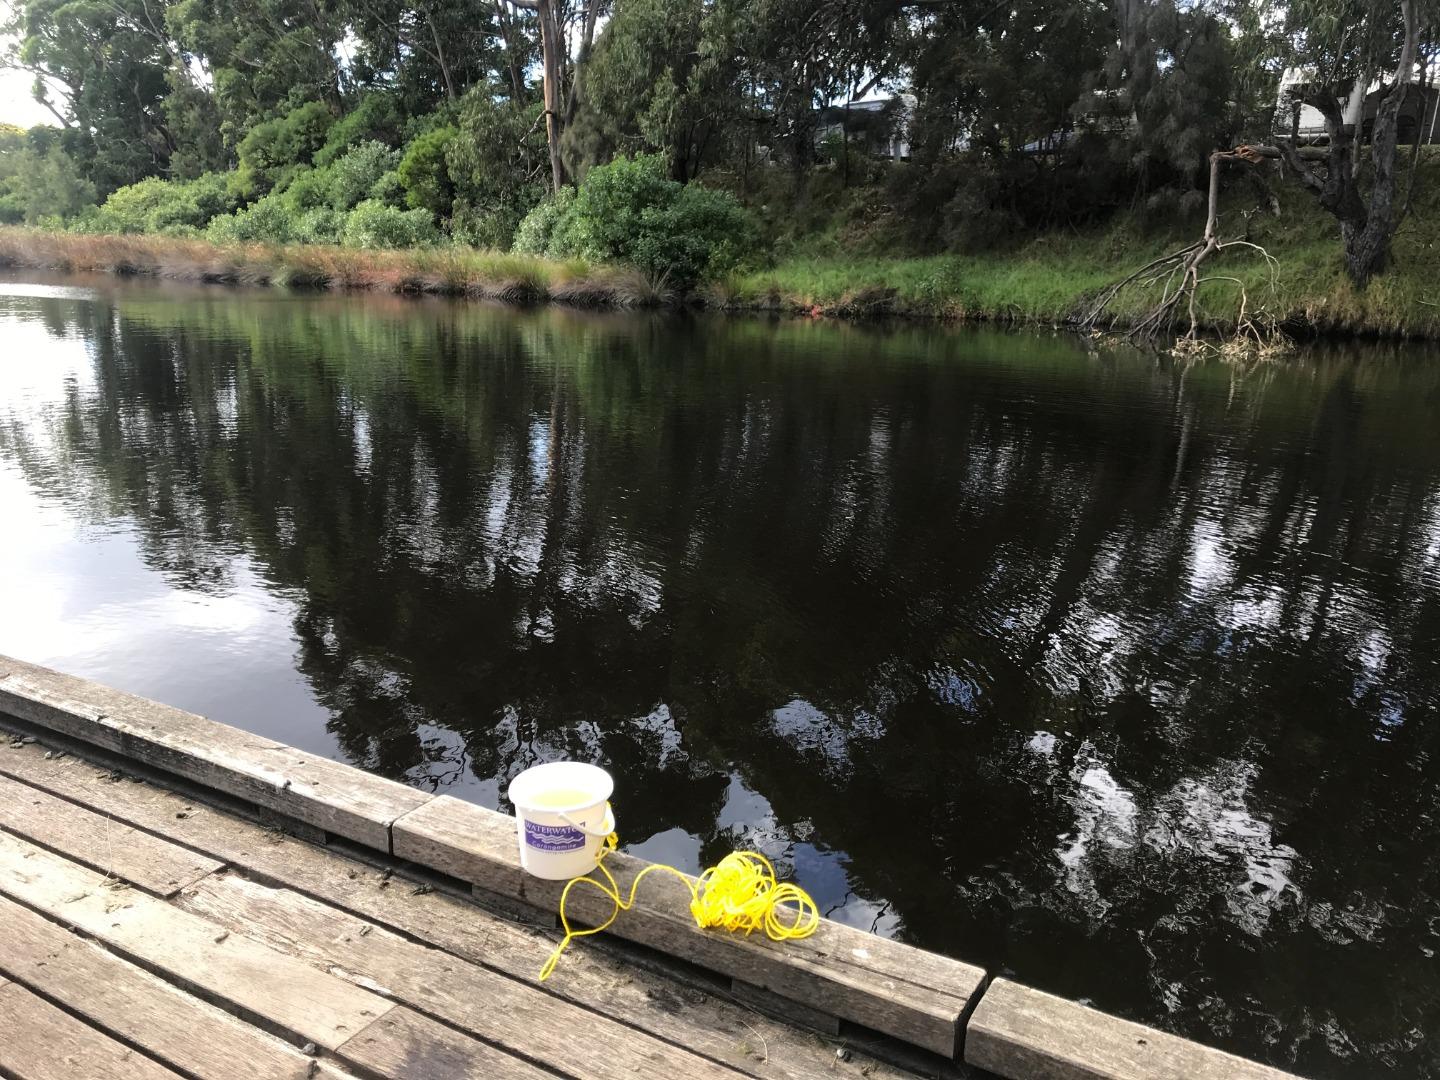
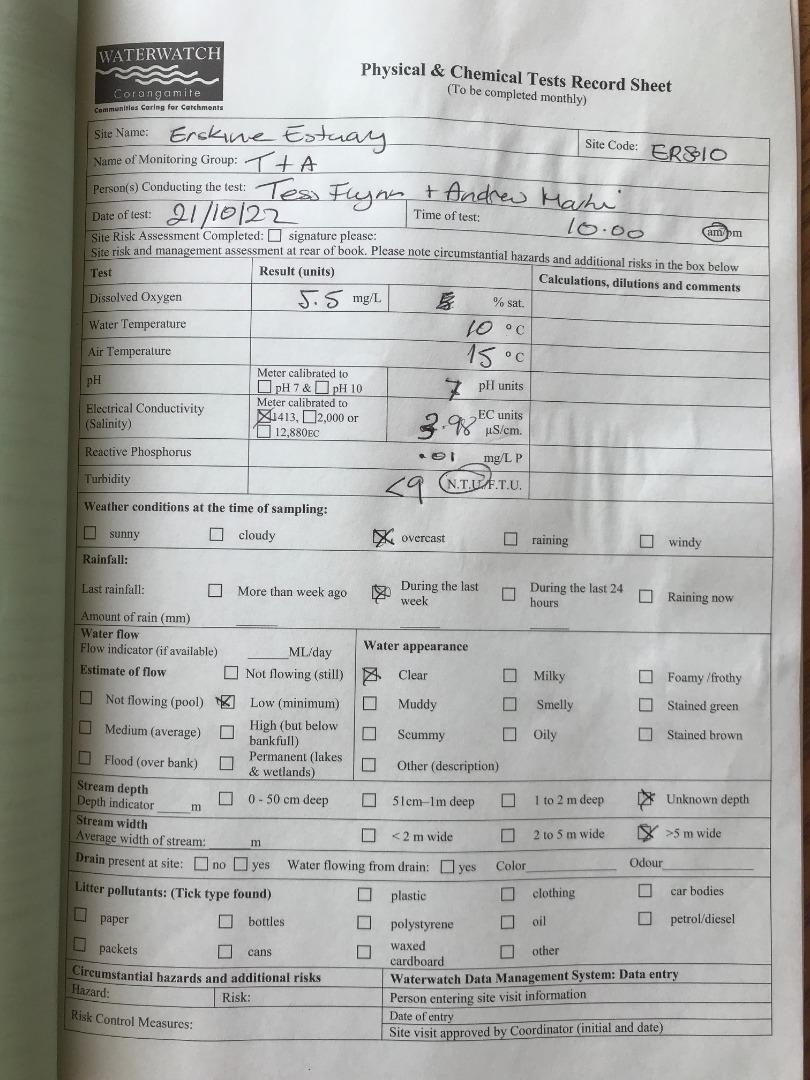
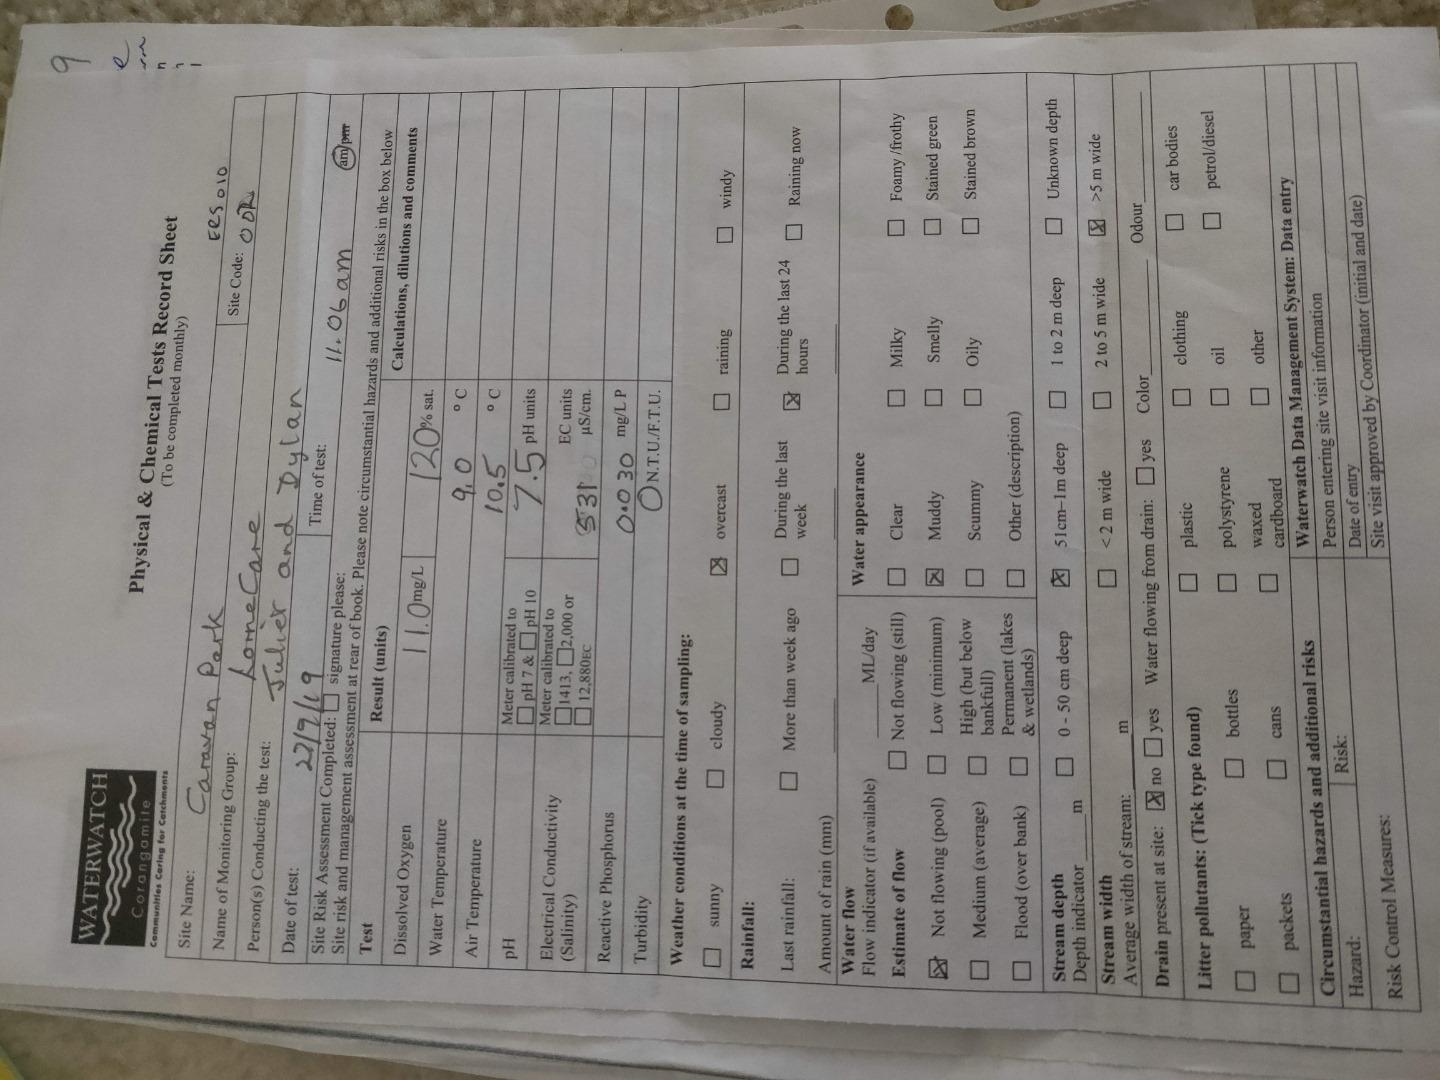
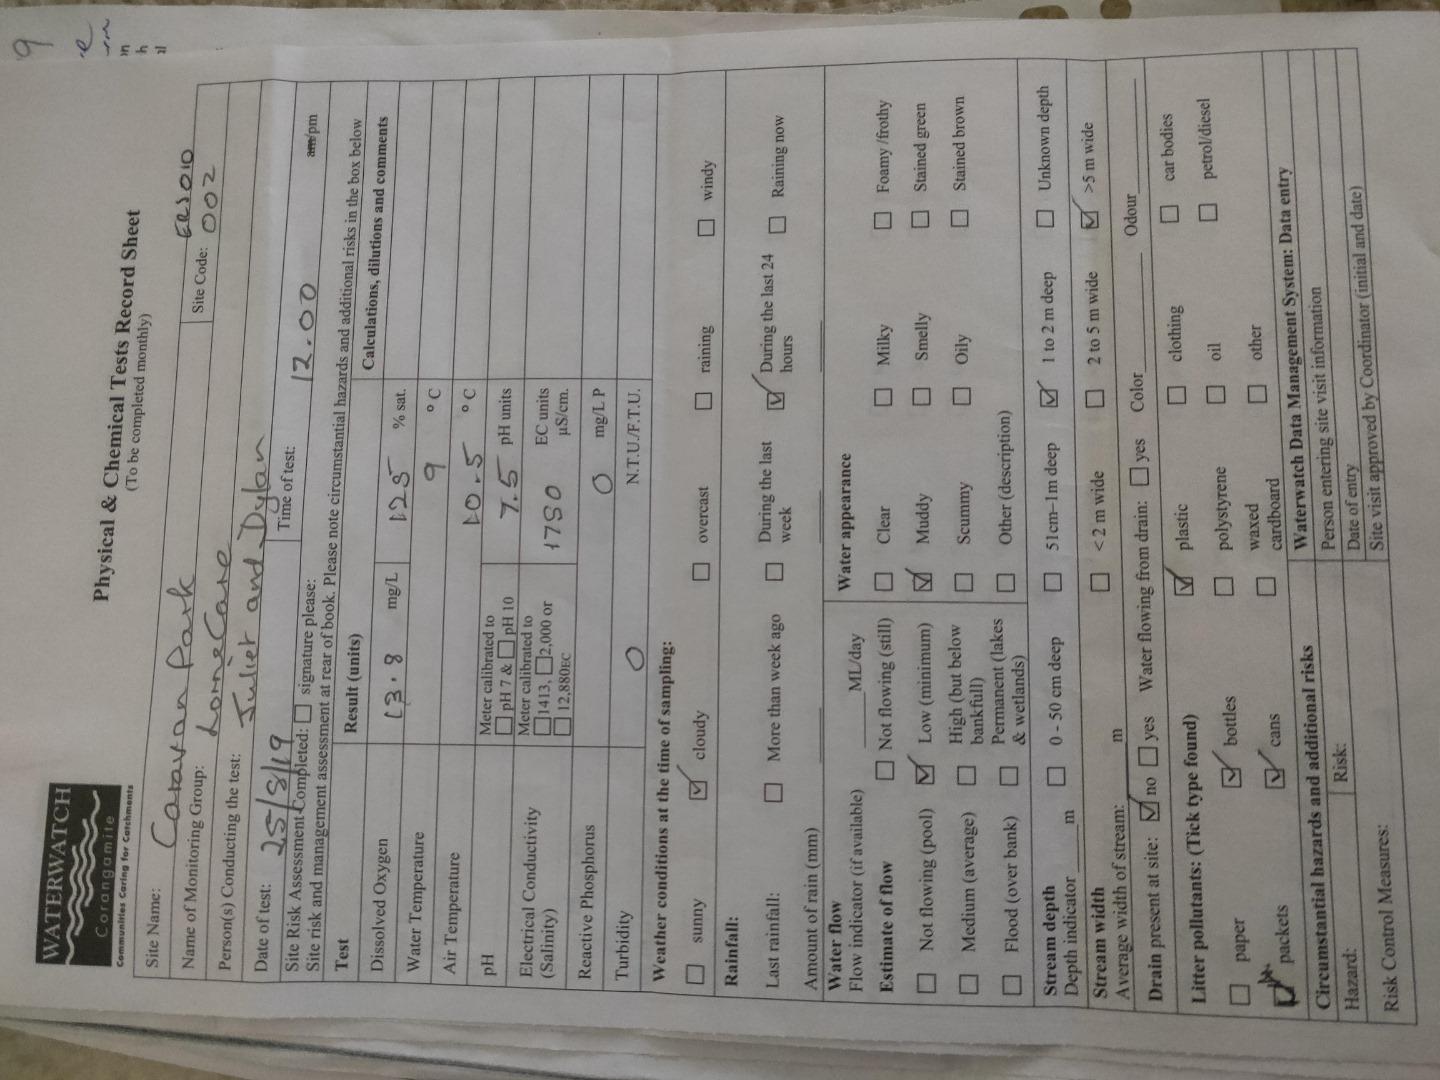
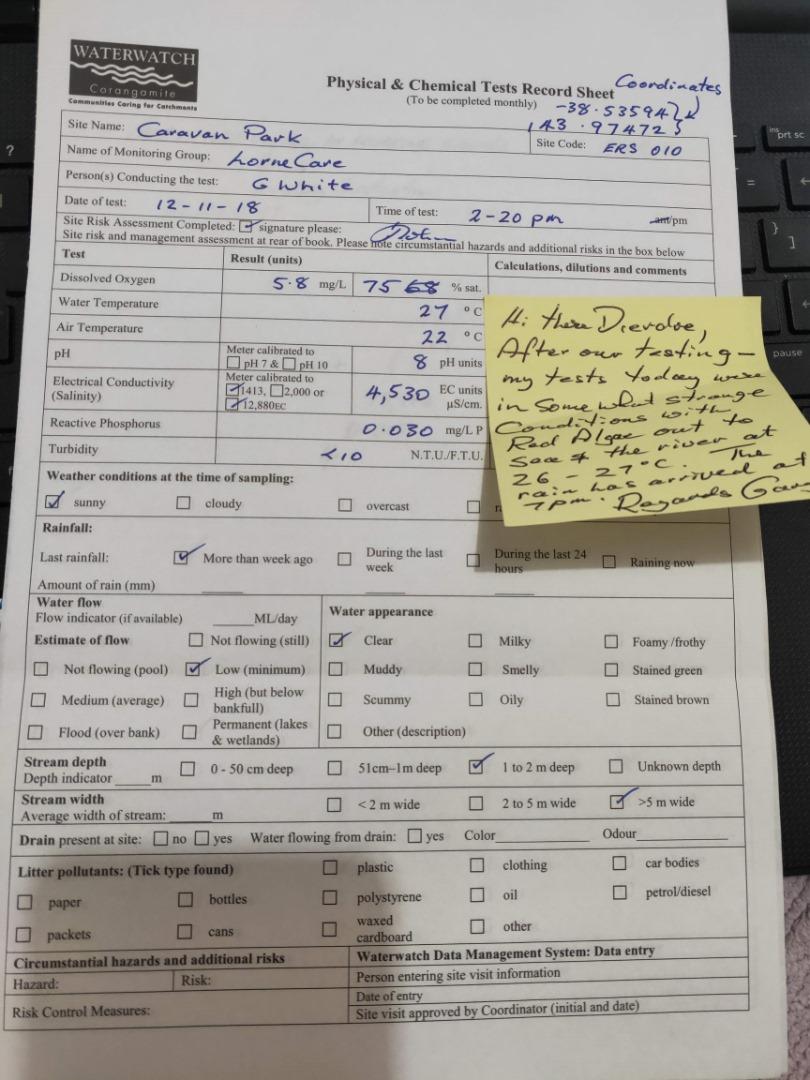
| Estuary. Located at the well used Lorne Caravan Park downstream of GOR bridge. Sampling site opposite "site 55". Training of G White with D Murphy and C McGee | |||||
| December 2000 | Fair | Fair | Poor | Poor | Fair |
| Rush along edges, introduced grass/couch @ site. Lots of rocks upstream for riffles protection. River in urban area beside caravan park, road and shops | |||||
| Date | Taxa Count | Total score | Rating |
|---|---|---|---|
| January 2008 | 213 | 21 |
| Date | Taxa Count | Weighted SIGNAL |
|---|
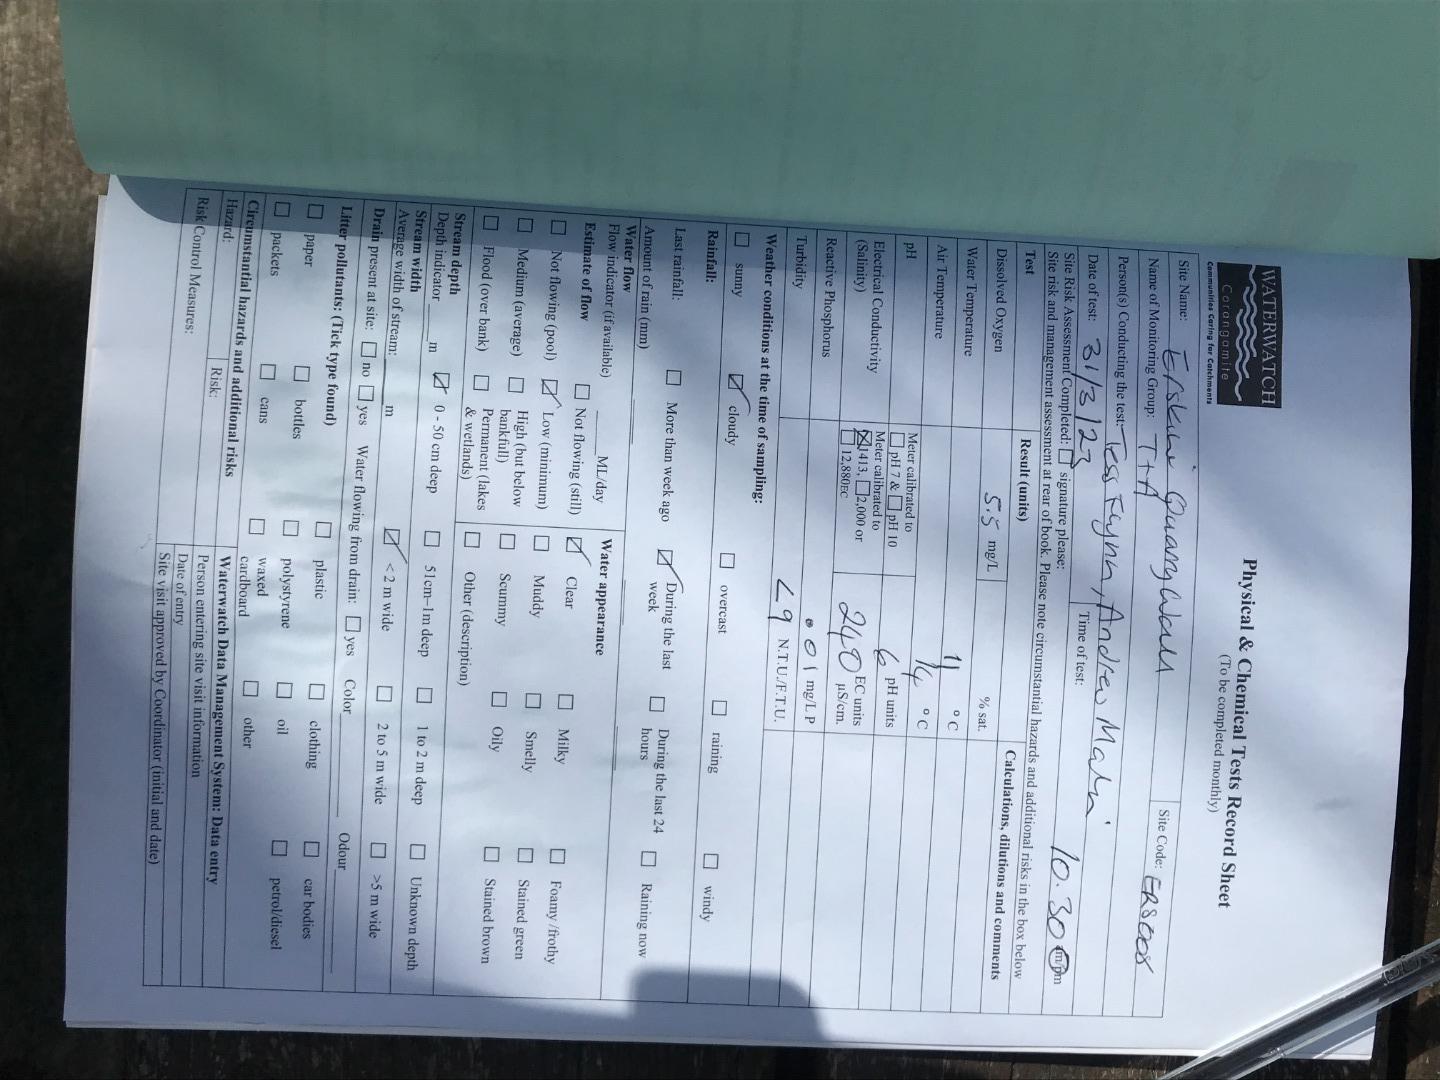
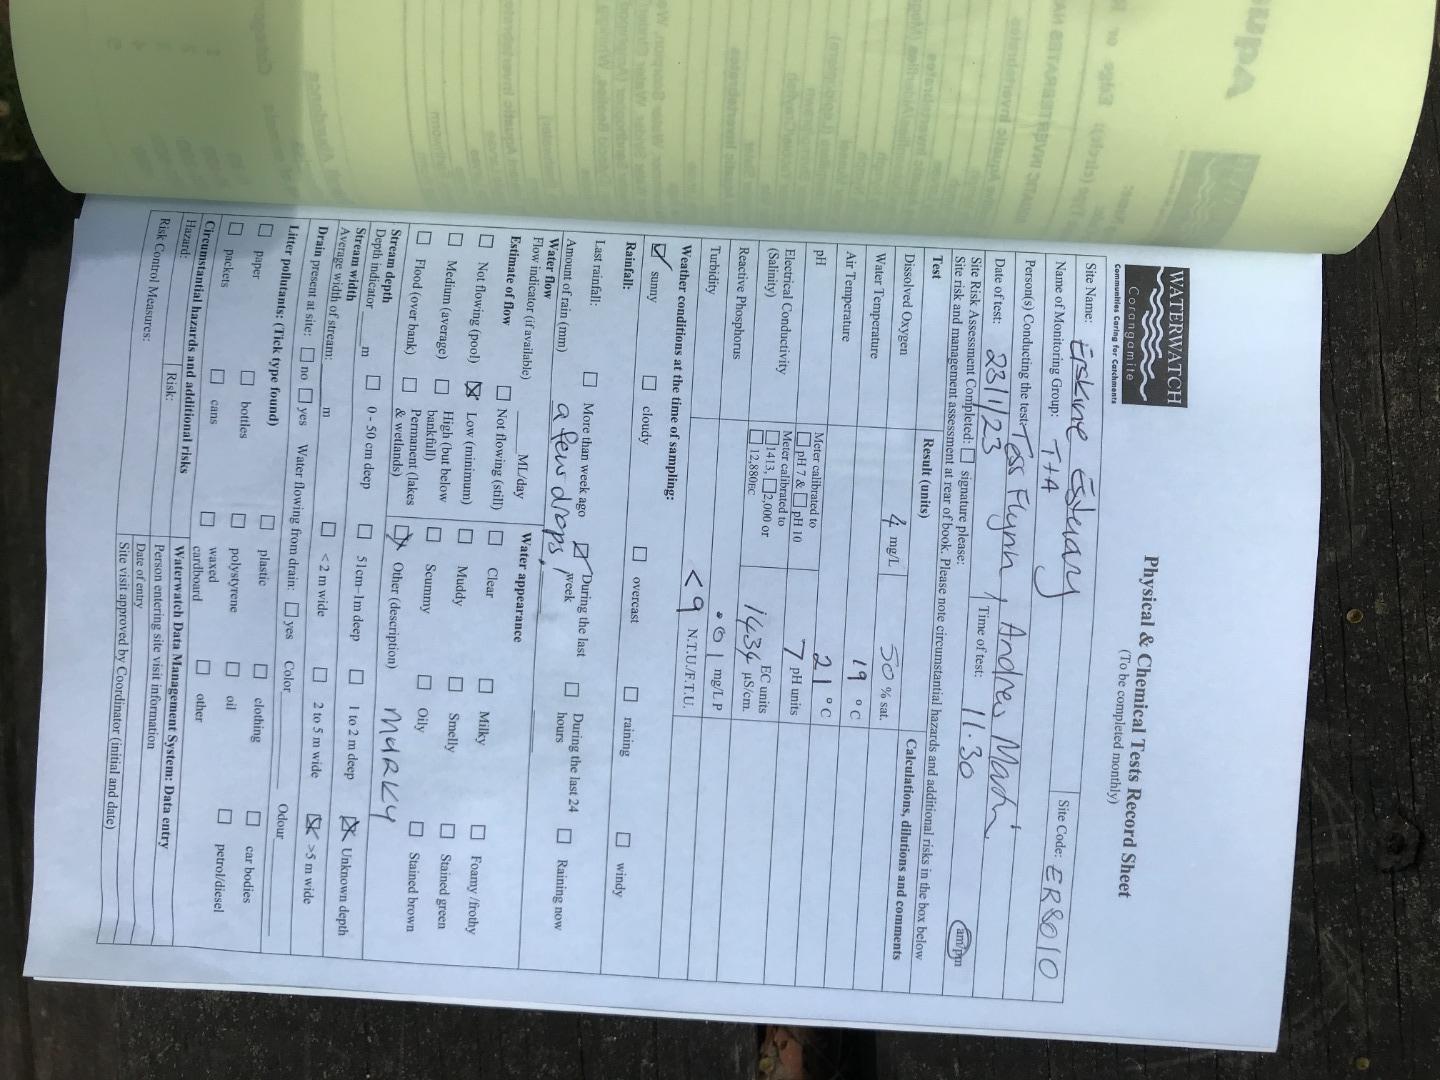
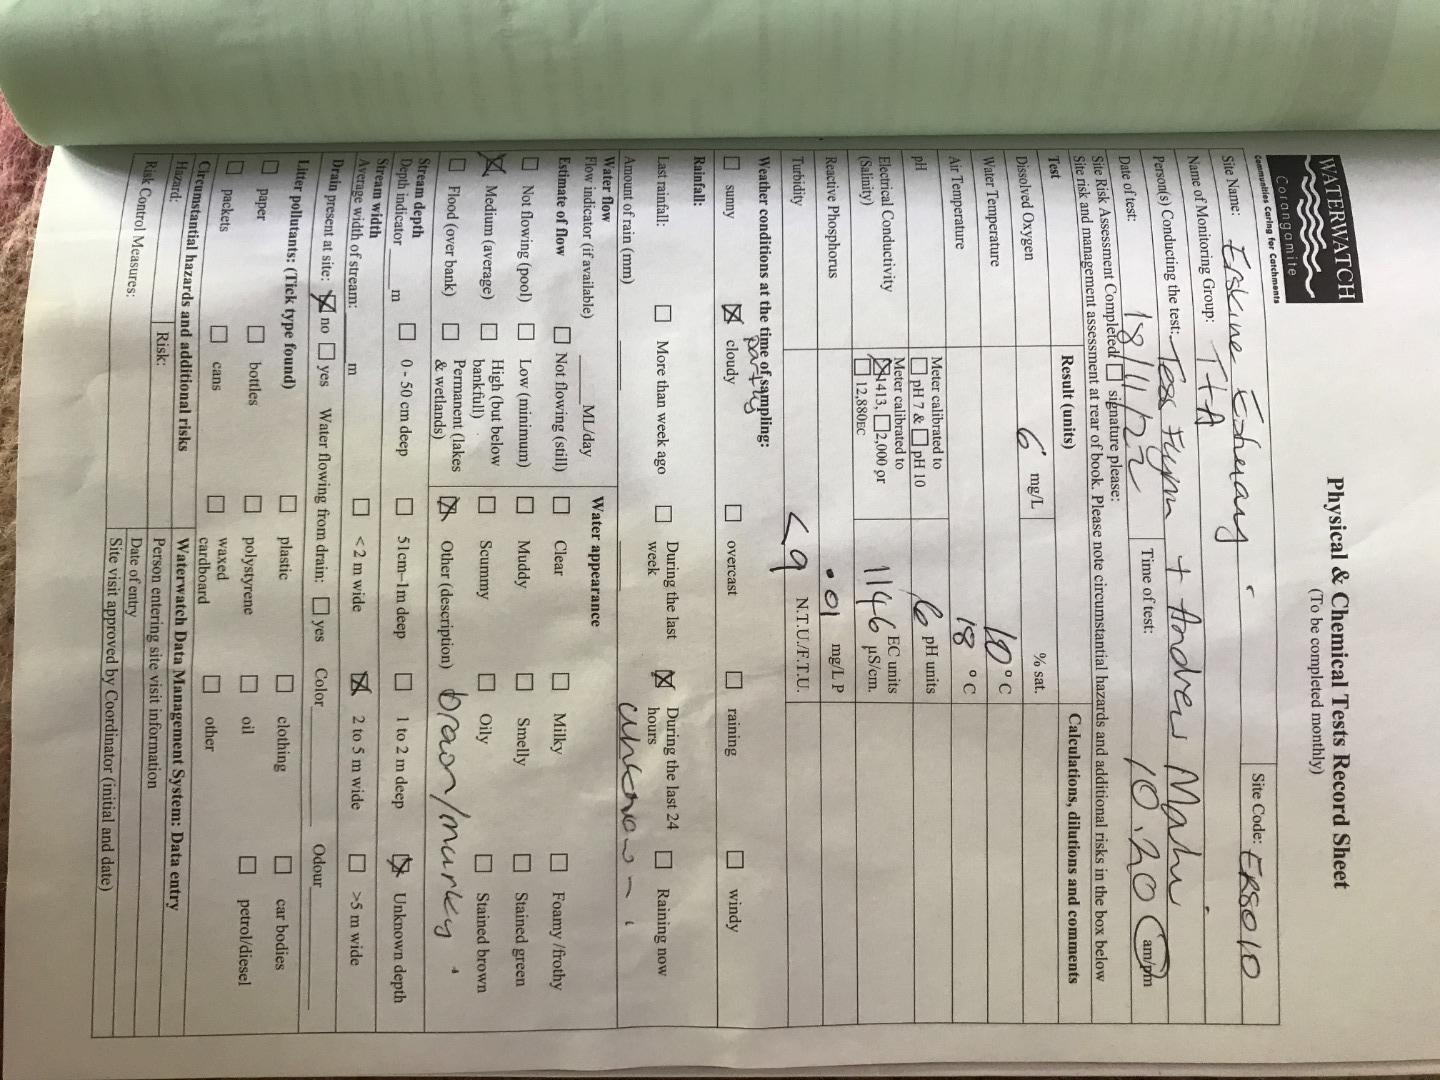
Dissolved Oxygen mg/LExplain for me 23-02-1995 to 23-07-2023
7.80 mg/L
Median 5.50mg/L Latest |
Nitrate - NitrogenExplain for me 23-04-2007 to 09-01-2019
0.00 mg/L N
Median 0.00mg/L N Latest |
Nitrite NO2Explain for me 01-03-2011 to 09-01-2019
0.00 mg/L
Median 0.00mg/L Latest |
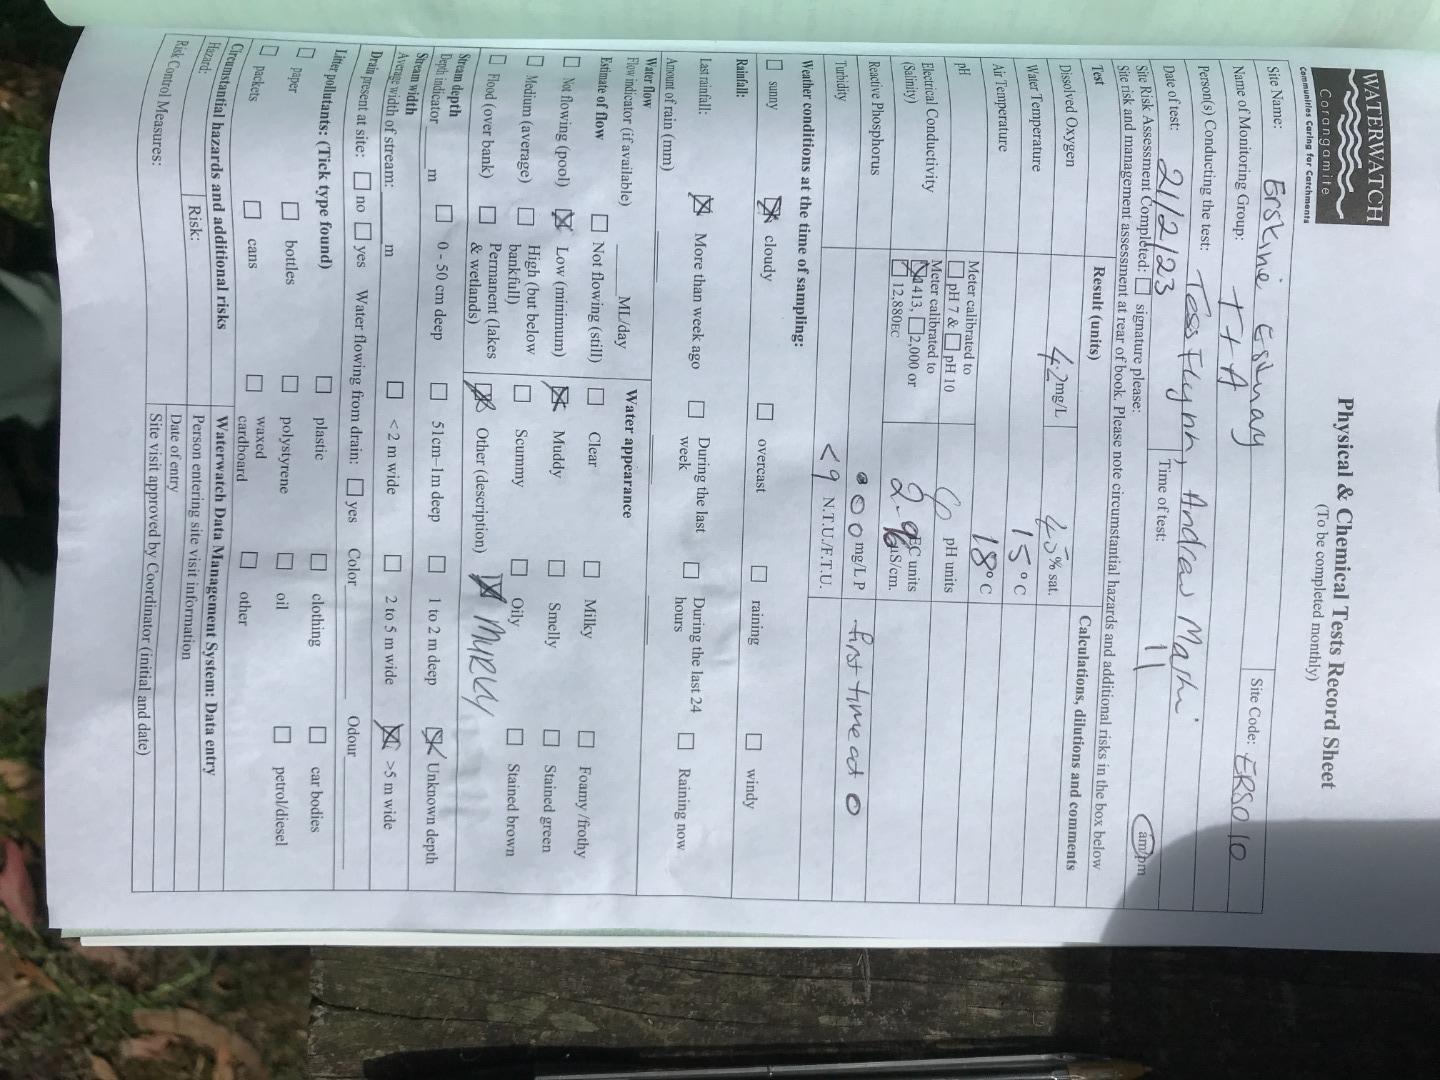
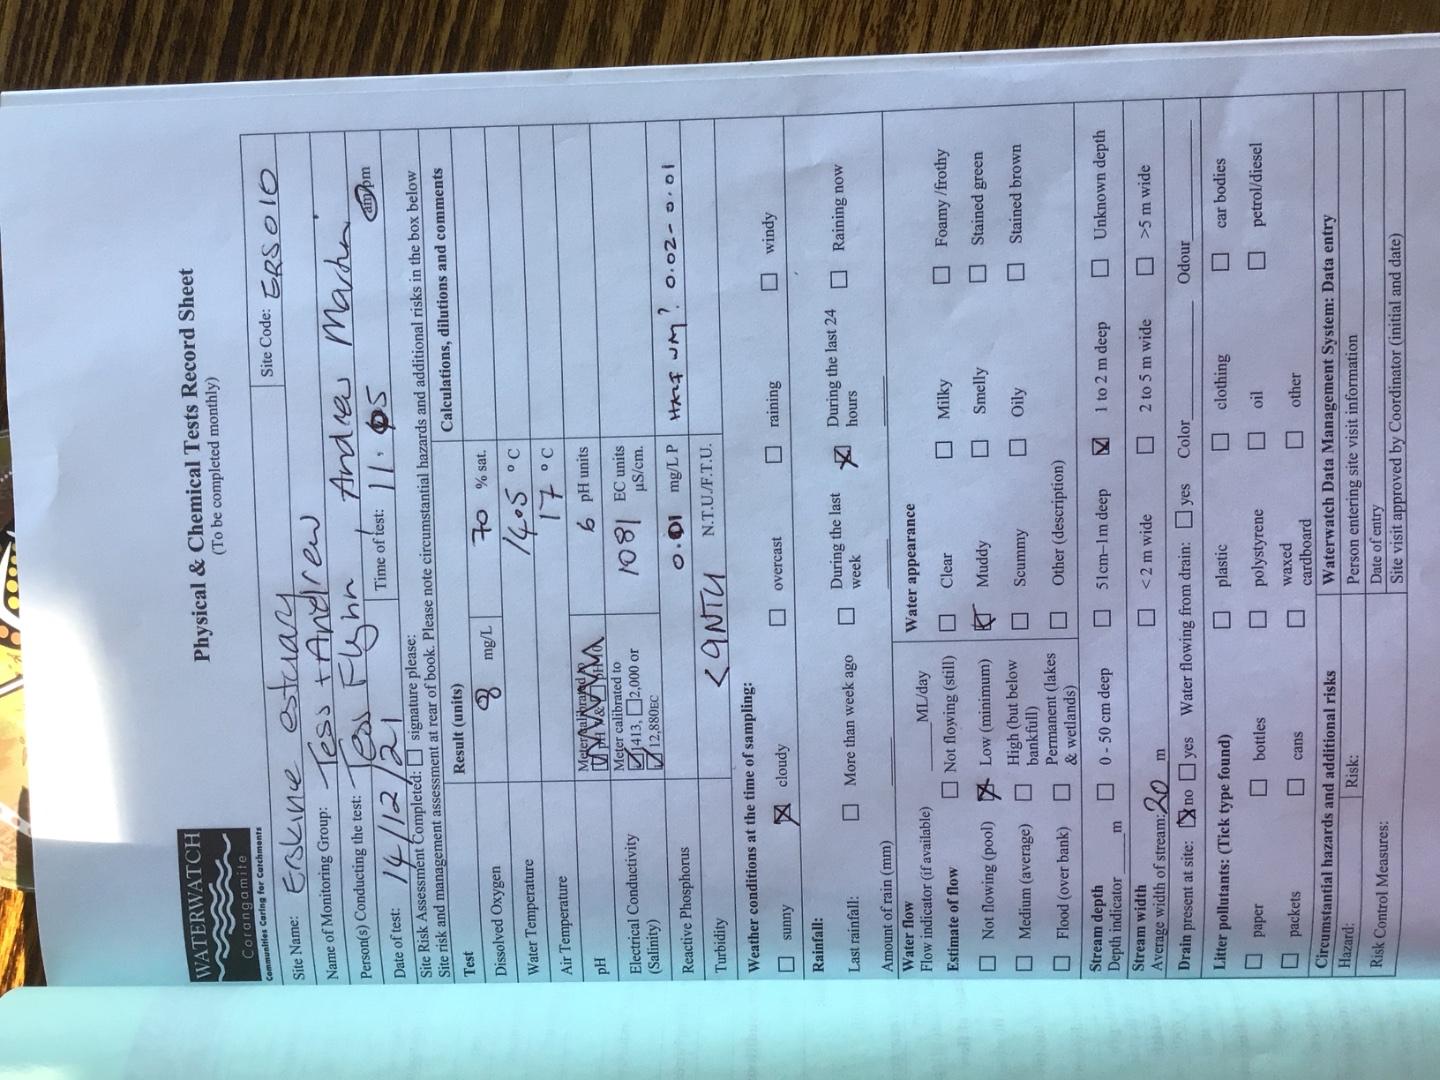
Temperature - WATERExplain for me 23-02-1995 to 23-07-2023
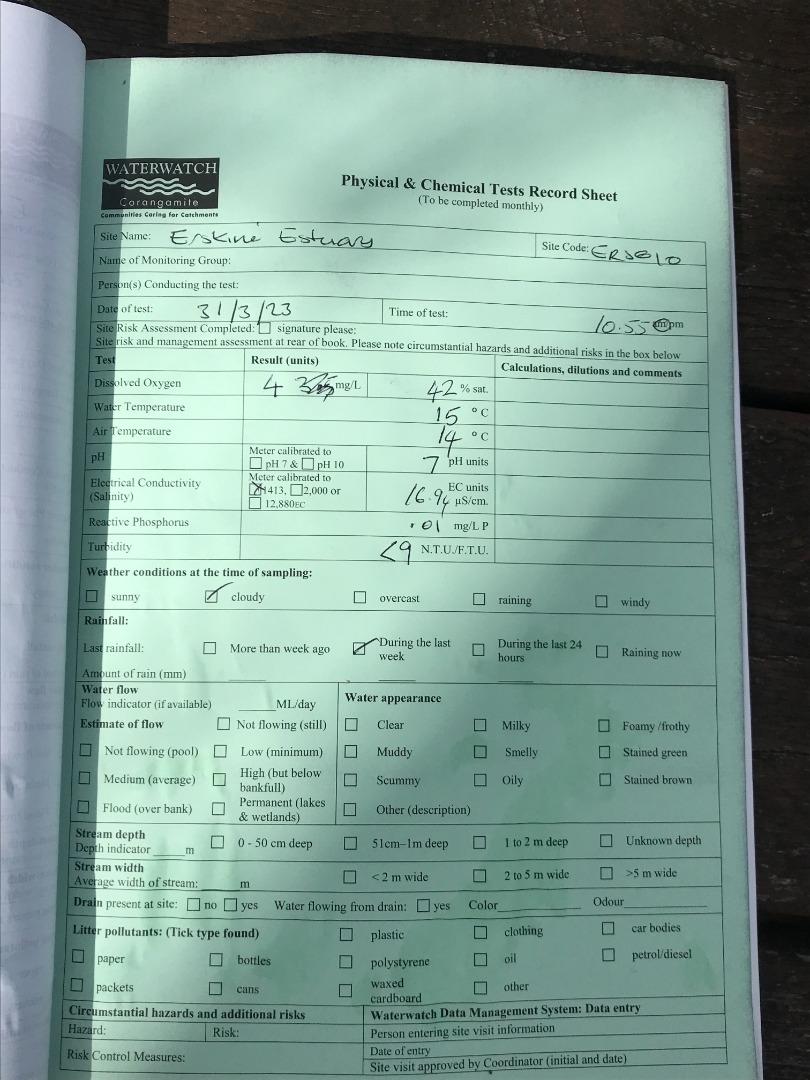
15.0 ° C
Median 7.0° C Latest |
pHExplain for me 09-03-1995 to 23-07-2023
7.50 pH Units
Median 6.00pH Units Latest |
Electrical ConductivityExplain for me 23-02-1995 to 23-07-2023
2050.00 µS/cm
Median 2.79µS/cm Latest |
Reactive Phosphate (mg/L)Explain for me 23-02-1995 to 23-07-2023
0.015 mg/L P
Median 0.010mg/L P Latest |
Dissolved Oxygen % SaturationExplain for me 21-02-2000 to 23-07-2023
82 %
Median 45% Latest |
Turbidity - NTUExplain for me 23-02-1995 to 23-07-2023
10 NTU
Median 9NTU Latest |
| Dissolved Oxygen Saturation | pH Lower | pH Upper | Electrical Conductivity | Turbidity | Reactive Phosphorus | |
|---|---|---|---|---|---|---|
| % | pH Units | pH Units | µS/cm | NTU | mg/L P | |
| 25th Percentile | 25th Percentile | 75th Percentile | 75th Percentile | 75th Percentile | 75th Percentile | |
2021 to 2026 |
||||||
2026 |
N/A0 visits |
N/A0 visits |
N/A0 visits |
N/A0 visits |
N/A0 visits |
N/A0 visits |
2025 |
N/A0 visits |
N/A0 visits |
N/A0 visits |
N/A0 visits |
N/A0 visits |
N/A0 visits |
2024 |
N/A0 visits |
N/A0 visits |
N/A0 visits |
N/A0 visits |
N/A0 visits |
N/A0 visits |
2023 |
||||||
2022 |
||||||
2021 |
N/A2 visits |
N/A2 visits |
N/A2 visits |
N/A2 visits |
N/A2 visits |
N/A2 visits |
 All content, files, data and images provided by the WaterWatch Data Portal subject to a Creative Commons Attribution License
Data portal by CeRDI
All content, files, data and images provided by the WaterWatch Data Portal subject to a Creative Commons Attribution License
Data portal by CeRDI