Inactive
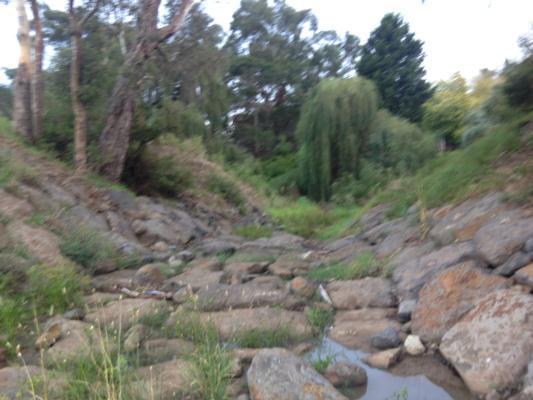
| Bank Erosion Stability | Bank Vegetation | In Stream Cover | Riffles Pools Bends | Verge Vegetation | |
|---|---|---|---|---|---|
| April 2014 | Fair | Fair | Fair | Fair | Good |
| Date | Taxa Count | Total score | Rating |
|---|
Temperature - WATERExplain for me 03-06-2010 to 14-06-2017
12.0 ° C
Median 12.0° C Latest |
pHExplain for me 03-06-2010 to 14-06-2017
7.00 pH Units
Median 6.50pH Units Latest |
Electrical ConductivityExplain for me 16-07-2010 to 14-06-2017
300.00 µS/cm
Median 251.00µS/cm Latest |
Reactive Phosphate (mg/L)Explain for me 03-06-2010 to 14-06-2017
0.030 mg/L P
Median 0.110mg/L P Latest |
Turbidity - NTUExplain for me 03-06-2010 to 14-06-2017
31 NTU
Median 36NTU Latest |
July 2016
July 2016
July 2016
June 2016
June 2016
June 2016
May 2016
May 2016
March 2016
March 2016
March 2015
April 2015
May 2015
July 2014
July 2014
July 2014
 All content, files, data and images provided by the WaterWatch Data Portal subject to a Creative Commons Attribution License
Data portal by CeRDI
All content, files, data and images provided by the WaterWatch Data Portal subject to a Creative Commons Attribution License
Data portal by CeRDI