Active
| ME_RMIT Students |
| Bank Erosion Stability | Bank Vegetation | In Stream Cover | Riffles Pools Bends | Verge Vegetation | |
|---|---|---|---|---|---|
| October 2024 | Good | Good | Fair | Poor | Fair |
| September 2024 | Fair | Fair | Poor | Poor | Fair |
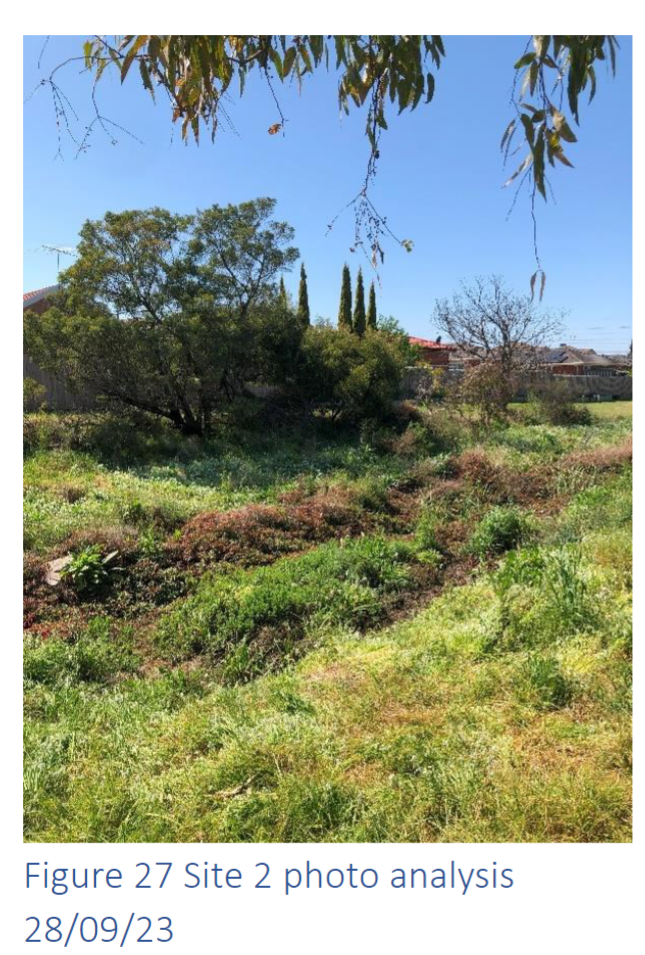
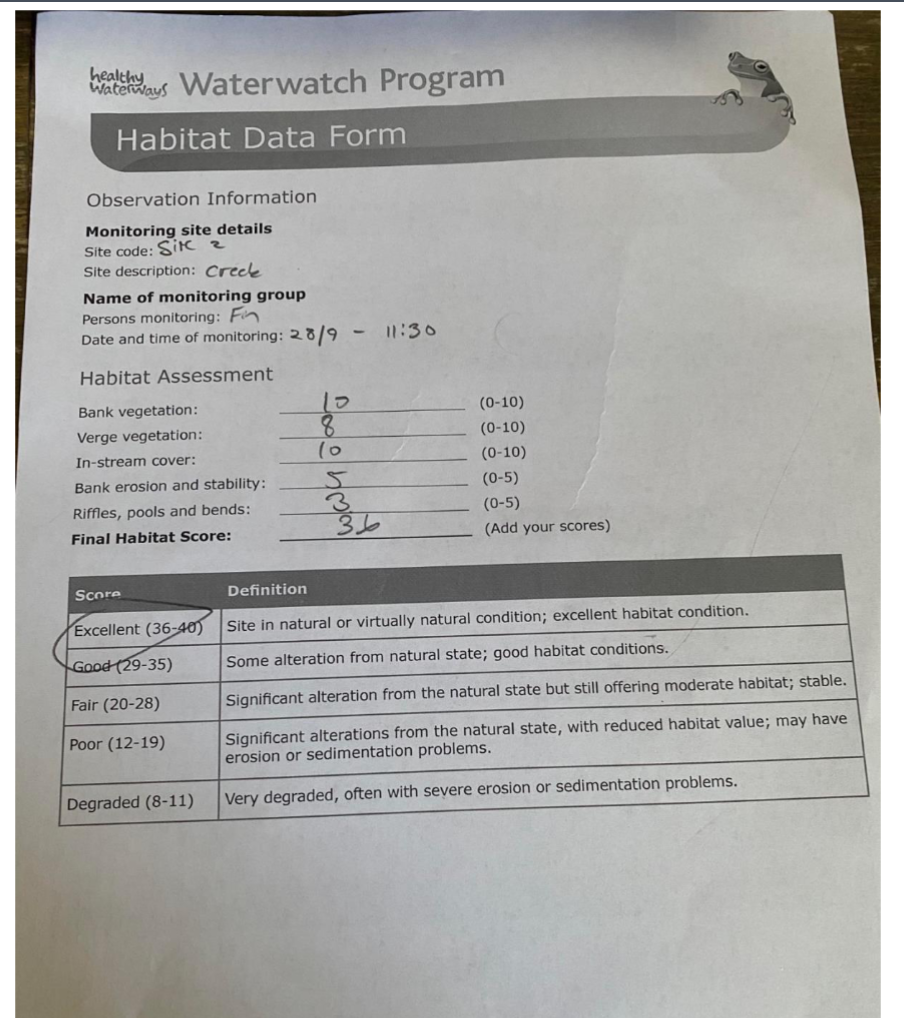
| September 2023 | Excellent | Excellent | Excellent | Fair | Good |
| September 2023 | Excellent | Excellent | Poor | Fair | Good |
| August 2023 | Excellent | Fair | Excellent | Fair | Fair |
| May 2023 | Fair | Poor | Poor | Poor | Fair |
Difficult to access water due to dense weeds |
|||||
| April 2023 | Fair | Fair | Poor | Poor | Fair |
| February 2023 | Fair | Fair | Poor | Fair | Fair |
Deep, narrow, overgrown with weeds |
|||||
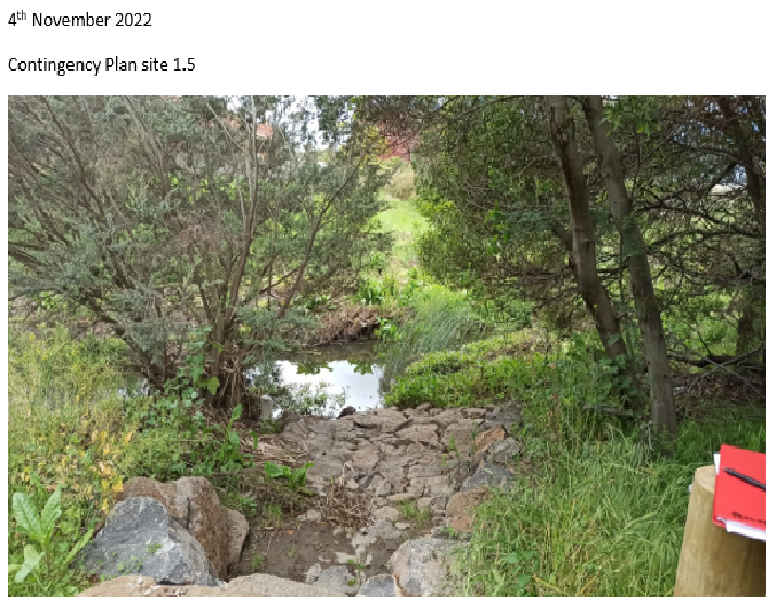
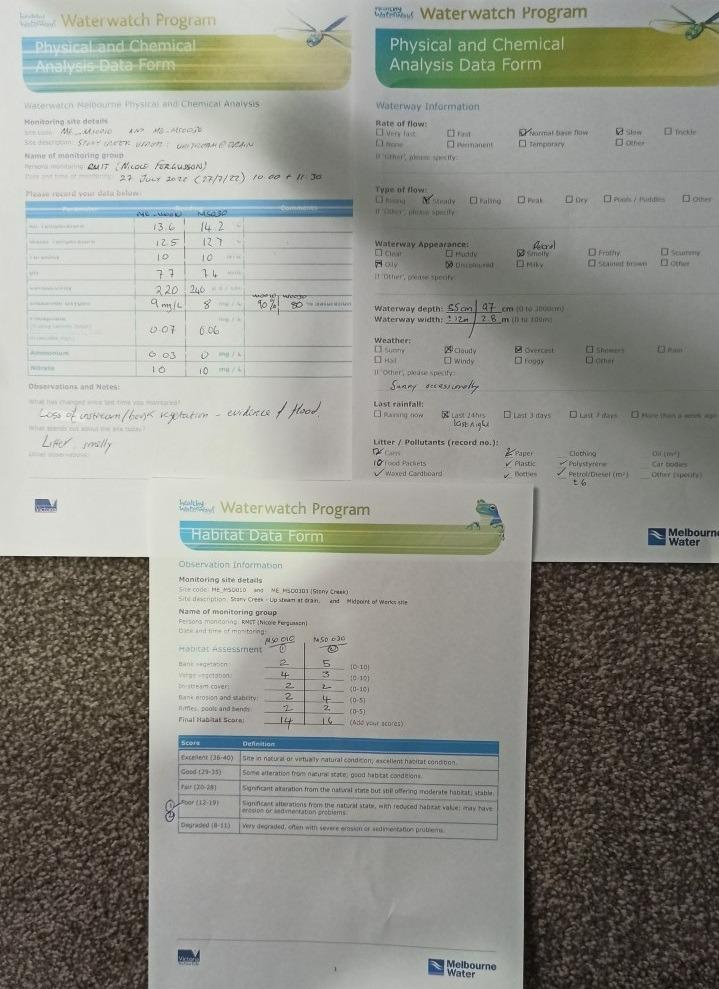
| November 2022 | Fair | Fair | Fair | Poor | Fair |
Contingency site |
|||||
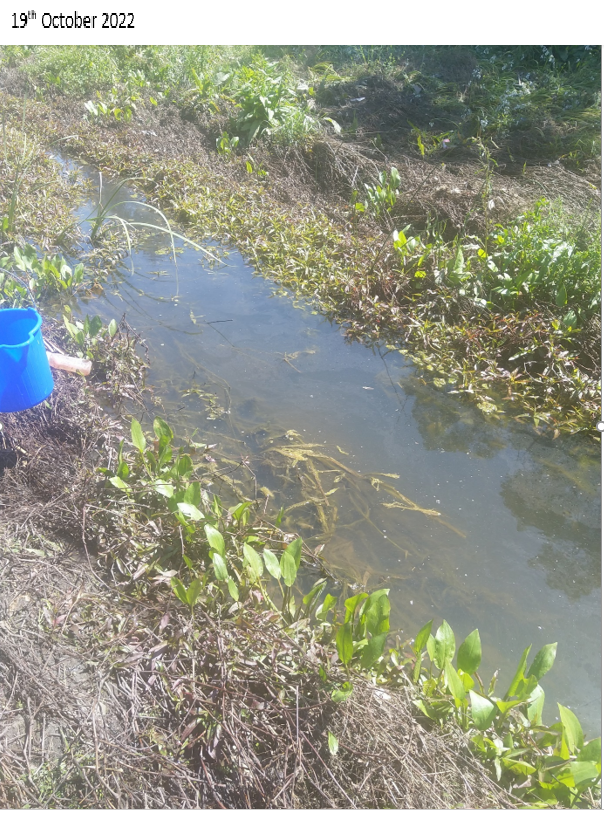
| October 2022 | Good | Fair | Fair | Fair | Fair |
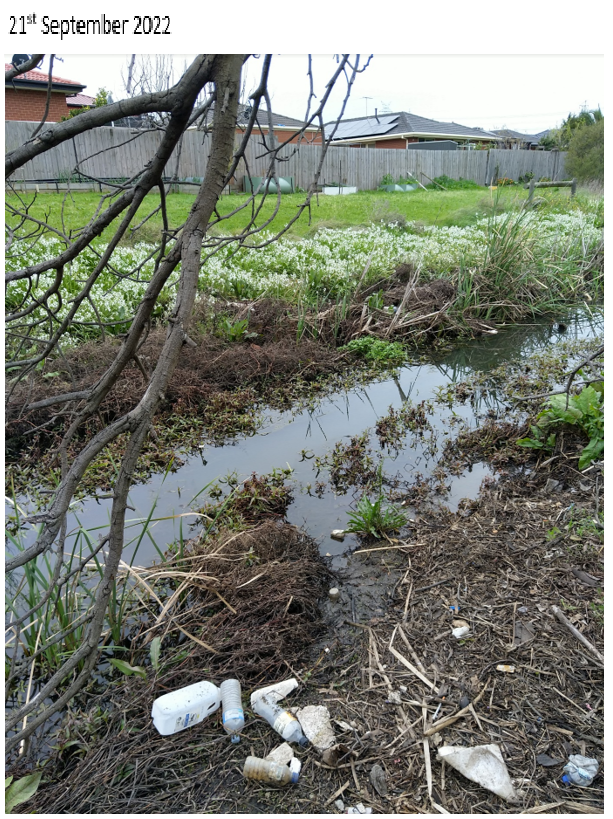
| September 2022 | Good | Fair | Fair | Fair | Poor |
| August 2022 | Good | Fair | Poor | Fair | Fair |
| July 2022 | Good | Poor | Poor | Poor | Poor |
missing phtograph |
|||||
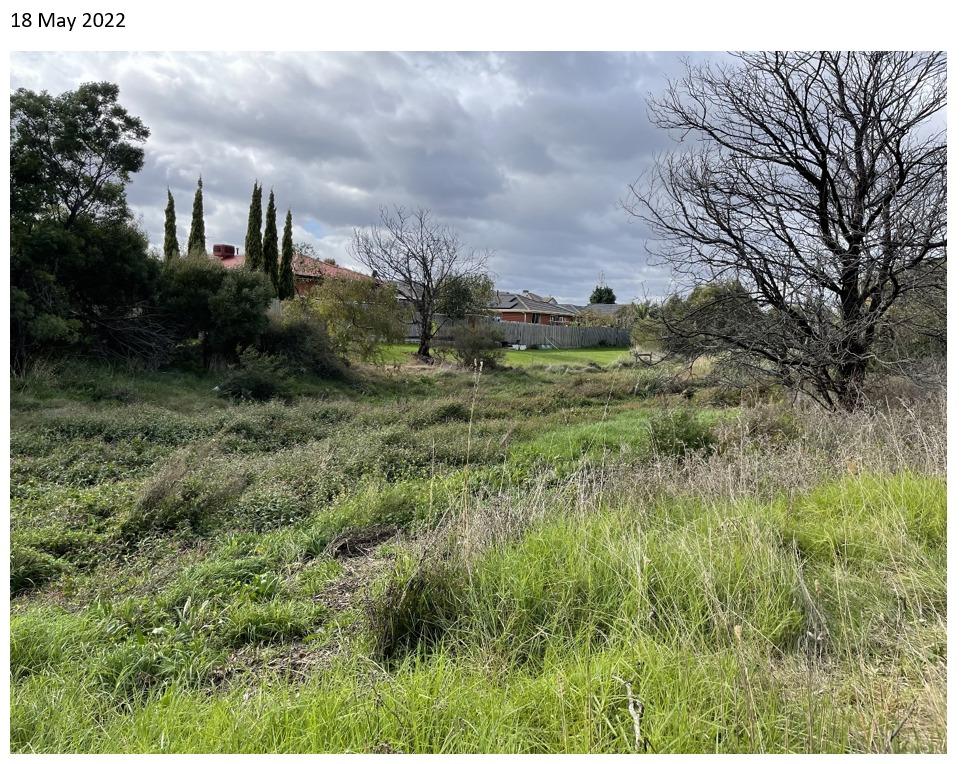
| May 2022 | Good | Poor | Fair | Good | Poor |
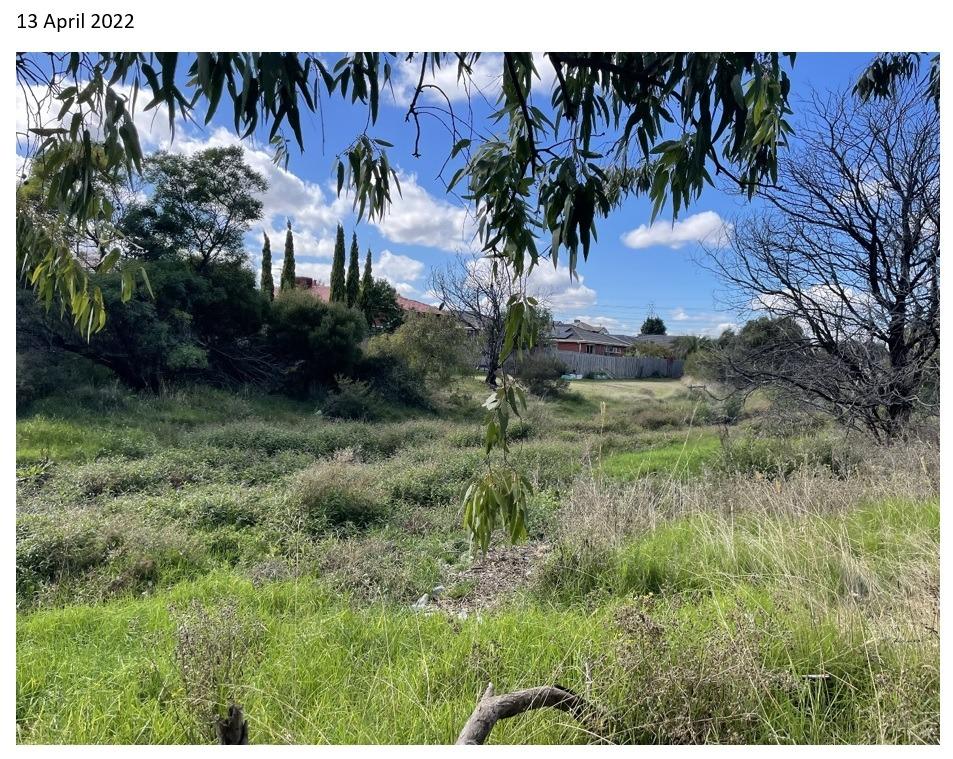
| April 2022 | Good | Fair | Fair | Fair | Fair |
| March 2022 | Fair | Good | Fair | Fair | Fair |
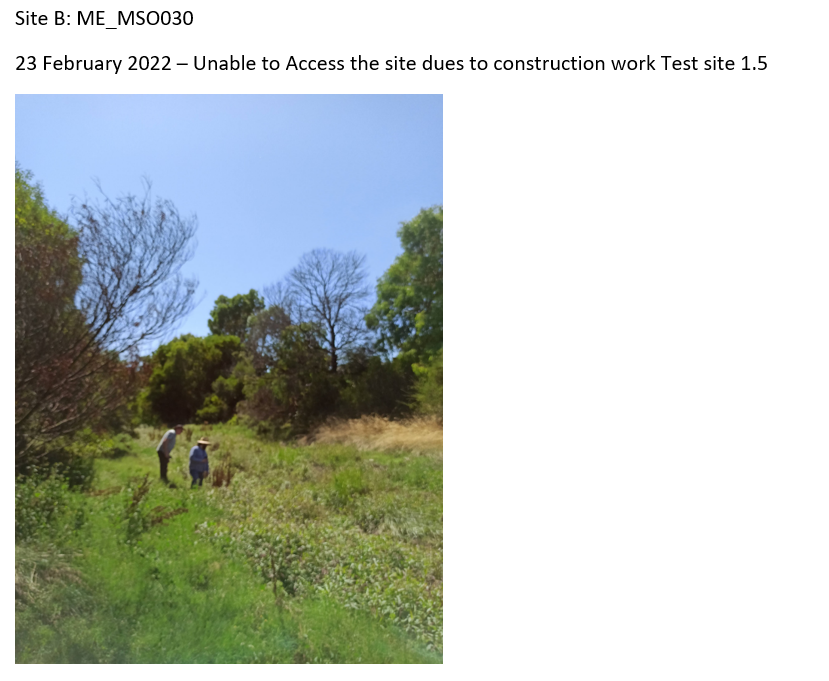
| February 2022 | Fair | Fair | Good | Good | Fair |
| February 2020 | Excellent | Fair | Fair | Poor | Poor |
| February 2019 | Good | Fair | Fair | Fair | Poor |
| Date | Taxa Count | Total score | Rating |
|---|---|---|---|
| April 2023 | 263 | 23 | |
| November 2022 | 233 | 33 | |
| August 2022 | 49 | 24 | |
| May 2022 | 173 | 38 | |
| May 2019 | 39 | 14 | |
| March 2019 | 30 | 9 |
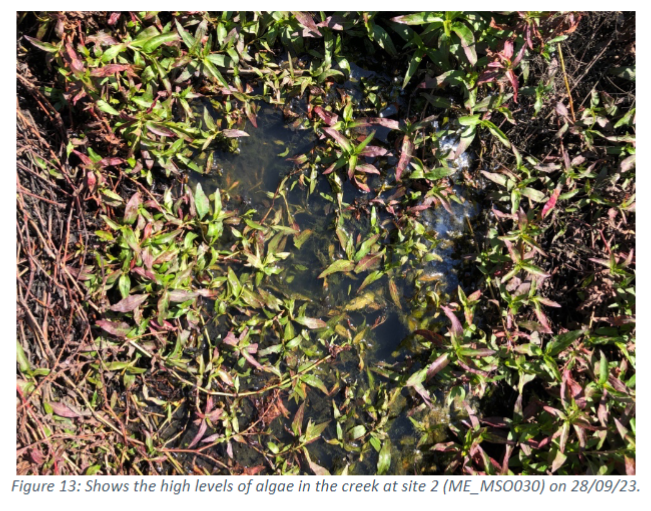
AmmoniumExplain for me 15-03-2019 to 03-10-2024
0.07 mg/L NH4+
Median 0.07mg/L NH4+ Latest |
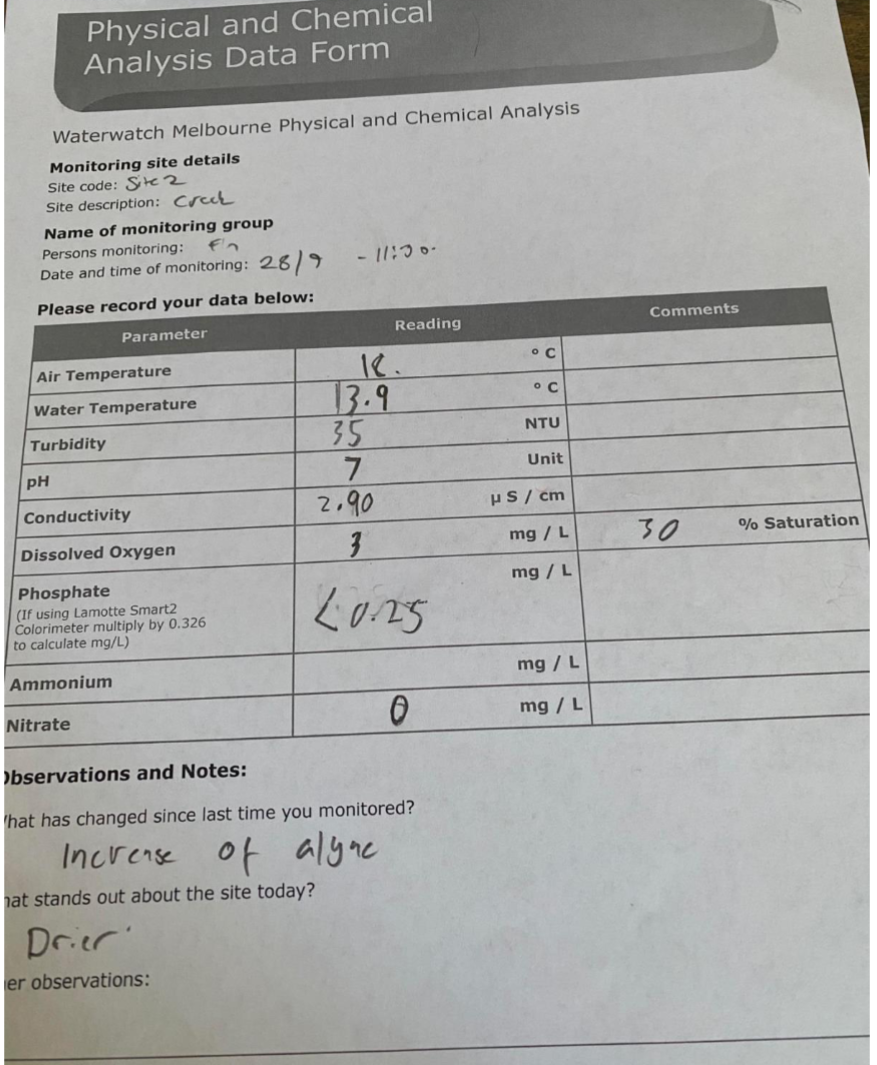
Dissolved Oxygen mg/LExplain for me 28-02-2019 to 10-05-2023
4.00 mg/L
Median 3.00mg/L Latest |
Nitrate NO3Explain for me 23-02-2022 to 03-10-2024
7.500 mg/L
Median 5.000mg/L Latest |
Temperature - WATERExplain for me 28-02-2019 to 03-10-2024
15.2 ° C
Median 16.1° C Latest |
pHExplain for me 28-02-2019 to 03-10-2024
7.40 pH Units
Median 7.30pH Units Latest |
Electrical ConductivityExplain for me 28-02-2019 to 03-10-2024
266.99 µS/cm
Median 197.00µS/cm Latest |
Reactive Phosphate (mg/L)Explain for me 28-02-2019 to 03-10-2024
0.197 mg/L P
Median 0.400mg/L P Latest |
Dissolved Oxygen % SaturationExplain for me 28-02-2019 to 03-10-2024
37 %
Median 45% Latest |
Turbidity - NTUExplain for me 28-02-2019 to 03-10-2024
10 NTU
Median 10NTU Latest |
| Dissolved Oxygen Saturation | pH Lower | pH Upper | Electrical Conductivity | Turbidity | Reactive Phosphorus | |
|---|---|---|---|---|---|---|
| % | pH Units | pH Units | µS/cm | NTU | mg/L P | |
| 25th Percentile | 25th Percentile | 75th Percentile | 75th Percentile | 75th Percentile | 75th Percentile | |
2021 to 2026 |
||||||
2026 |
N/A0 visits |
N/A0 visits |
N/A0 visits |
N/A0 visits |
N/A0 visits |
N/A0 visits |
2025 |
N/A0 visits |
N/A0 visits |
N/A0 visits |
N/A0 visits |
N/A0 visits |
N/A0 visits |
2024 |
N/A3 visits |
N/A3 visits |
N/A3 visits |
N/A3 visits |
N/A3 visits |
N/A3 visits |
2023 |
||||||
2022 |
||||||
2021 |
N/A0 visits |
N/A0 visits |
N/A0 visits |
N/A0 visits |
N/A0 visits |
N/A0 visits |
 All content, files, data and images provided by the WaterWatch Data Portal subject to a Creative Commons Attribution License
Data portal by CeRDI
All content, files, data and images provided by the WaterWatch Data Portal subject to a Creative Commons Attribution License
Data portal by CeRDI